Fig. 9.
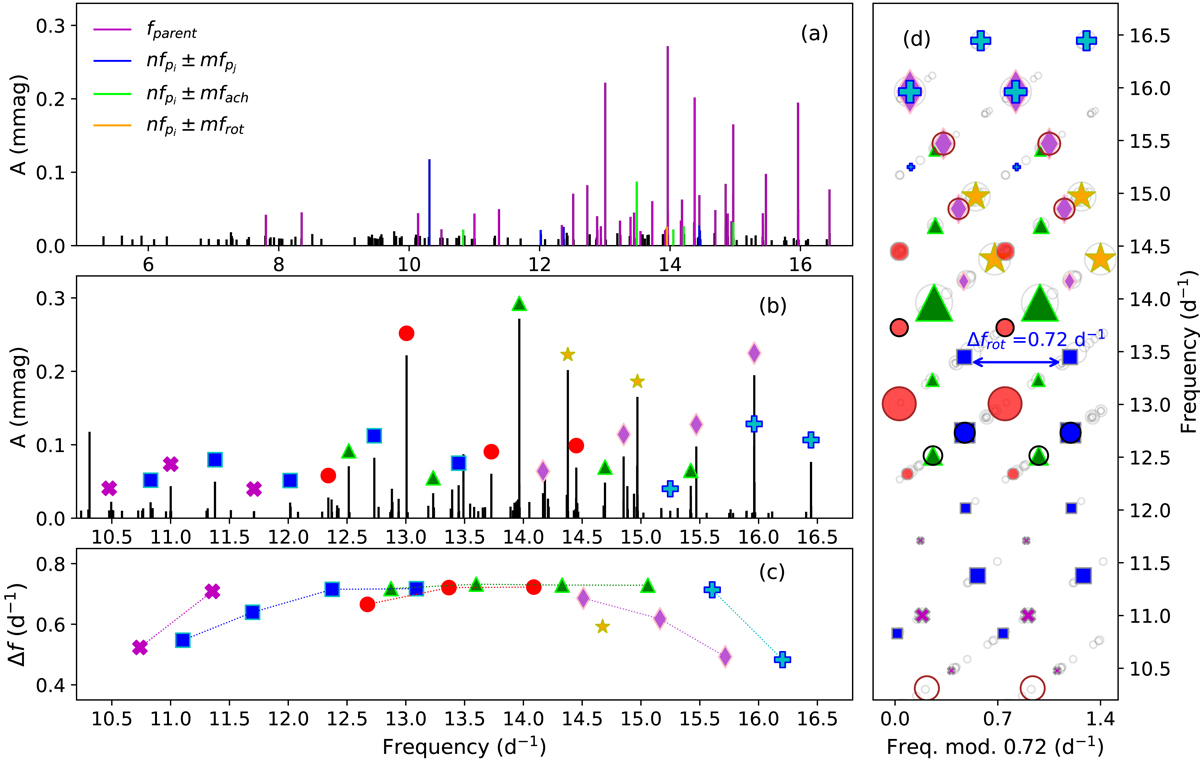
Download original image
High-frequency region (f ≥ 5 d−1) of the Fourier spectrum for the full Kepler LC observations of KIC 6951642. (a) Different types of combinations are detected among the significant frequencies (S/N ≥ 4; Table A.3). (b) Detection of rotationally split p modes in the interval (10.5–17) d−1 (Δfrot ≡ f3 = 0.721 d−1) (Table 8).(c) Detection of rotationally split values for the multiplets in panel b (Table 8). (d) The echelle diagram for the detected multiplets in panel b. Grey circles: the significant high-frequencies. The marker’s size is linked to the amplitude of the significant frequency. Black circles: The frequencies whose TDs show a similar long-term time delay trend (TDr in Table A.3). Brown circles: The frequencies showing incompatibility with general long-term time delay trend (TDir in Table A.3). Colours and indicators follow the descriptions of panels b and c.
Current usage metrics show cumulative count of Article Views (full-text article views including HTML views, PDF and ePub downloads, according to the available data) and Abstracts Views on Vision4Press platform.
Data correspond to usage on the plateform after 2015. The current usage metrics is available 48-96 hours after online publication and is updated daily on week days.
Initial download of the metrics may take a while.