Fig. 7.
Download original image
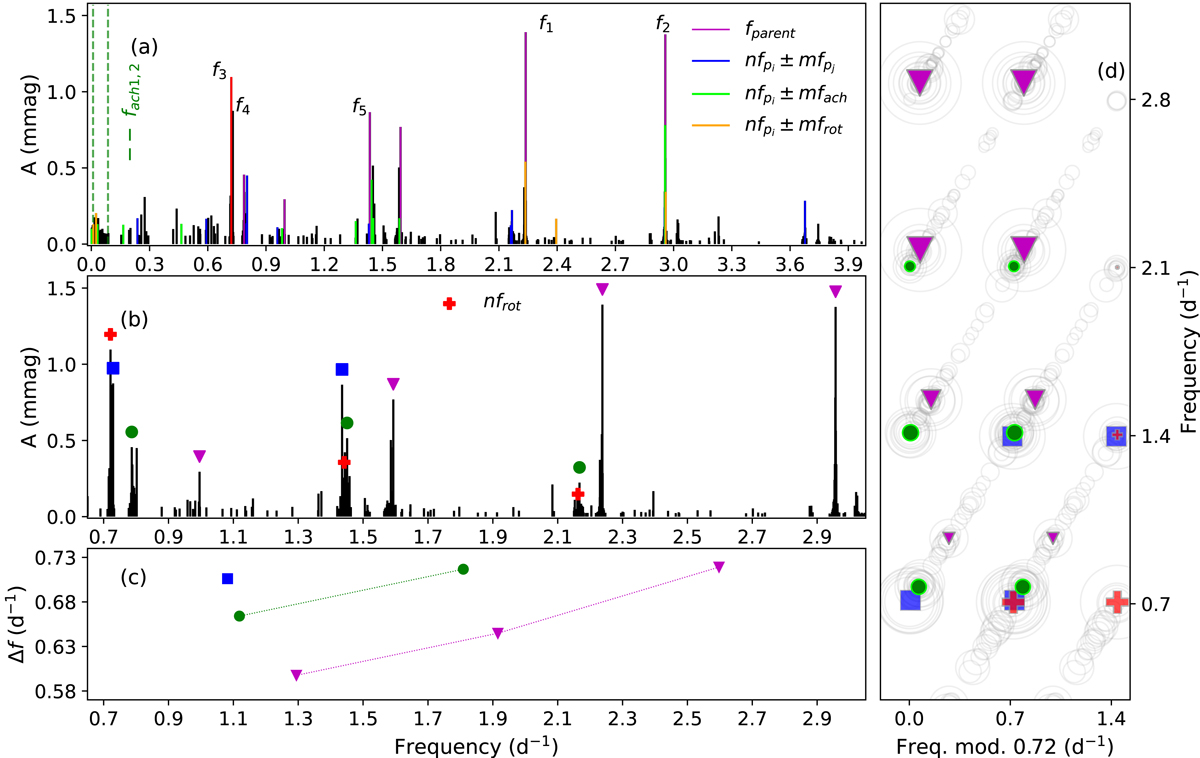
Low-frequency region (f ≤ 5 d−1) of the Fourier spectrum for the full Kepler LC observations of KIC 6951642. (a) Different types of combination frequencies are detected among the significant frequencies of this region (Table A.2). For the terminology, see Table 6. f1 − 5 represent the frequencies in descending order of amplitude (Table A.2.) (b) Identification of the rotational frequency: the frequencies shown with red pluses show the rotational frequency and its first and second harmonics (Table 7). (c) Detection of rotationally split values for the multiplets in panel b (Table 7). (d) The echelle diagram for the multiplets in panel b. Grey circles represent the significant low frequencies. The marker’s size is linked to the amplitude of the frequency. Colours and indicators follow the descriptions of panels b and c.
Current usage metrics show cumulative count of Article Views (full-text article views including HTML views, PDF and ePub downloads, according to the available data) and Abstracts Views on Vision4Press platform.
Data correspond to usage on the plateform after 2015. The current usage metrics is available 48-96 hours after online publication and is updated daily on week days.
Initial download of the metrics may take a while.