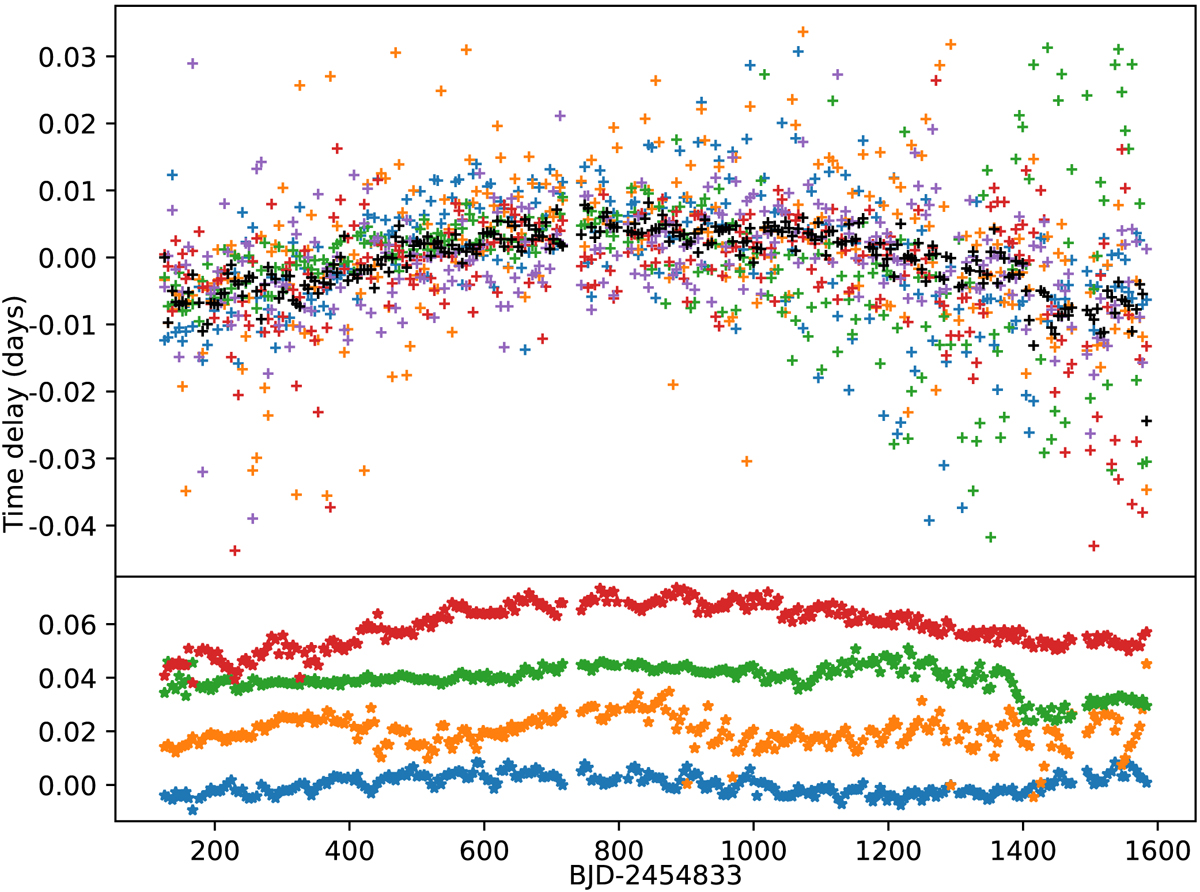
Fig. 3.
Download original image
TDs of high-frequencies. Top panel: eight frequencies displaying a similar long-term change: f39 = 13.0064 d−1 (fparent), f85 = 10.3107 d−1 (fcomb), f107 = 15.4706 d−1 (fparent), f123 = 14.8528 d−1 (fparent), f126 = 12.7318 d−1 (fparent), f146 = 12.5150 d−1 (fparent), and f178 = 13.7274 d−1, f43 = 14.3778 d−1. Their mean values are plotted in black. Bottom panel: three frequencies whose behaviour is incompatible with the general trend: f31 = 13.9651 d−1 (fpmax, in blue), f59 = 14.9697 d−1 (fparent, in orange) and f44 = 15.9634 d−1 (fparent, in green), and f178 = 13.7274 d−1, f43 = 14.3778 d−1. We re-plotted f43 = 14.3778 d−1 (fparent, in red) in the lower panel for means of comparison with the frequencies that have incompatible trends in top panel. See Table 6 for the used terminology.
Current usage metrics show cumulative count of Article Views (full-text article views including HTML views, PDF and ePub downloads, according to the available data) and Abstracts Views on Vision4Press platform.
Data correspond to usage on the plateform after 2015. The current usage metrics is available 48-96 hours after online publication and is updated daily on week days.
Initial download of the metrics may take a while.