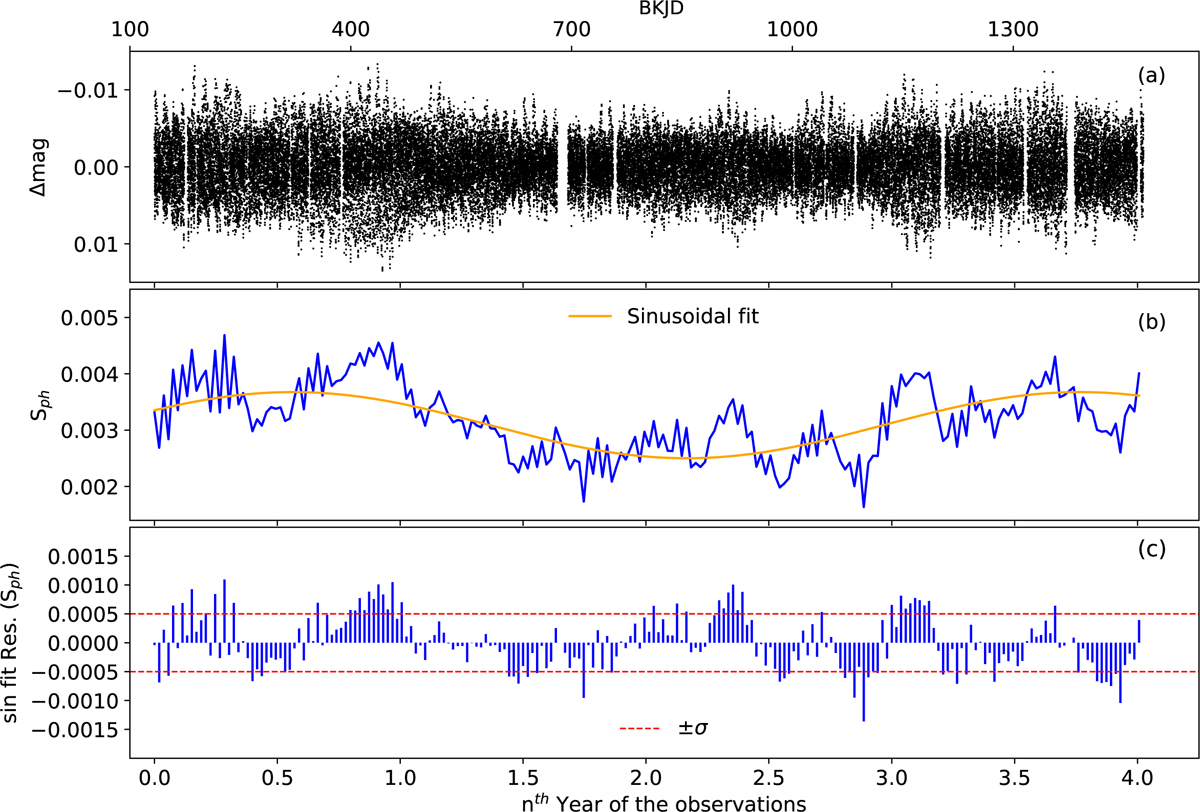
Fig. A.2.
Download original image
The photospheric magnetic activity proxy Sph of KIC 6951642. (a) Kepler LC light curve (1470.46 d) (b) Dispersion of the light curve on time scales of 5frot (frot = 0.721 d−1). Red dashed lines are an illustration of boundaries of maximum magnetic and minimum activity cycles of star. Orange curve presents the sinusoidal fit to Sph in different cycles.
Current usage metrics show cumulative count of Article Views (full-text article views including HTML views, PDF and ePub downloads, according to the available data) and Abstracts Views on Vision4Press platform.
Data correspond to usage on the plateform after 2015. The current usage metrics is available 48-96 hours after online publication and is updated daily on week days.
Initial download of the metrics may take a while.