Open Access
Fig. 2
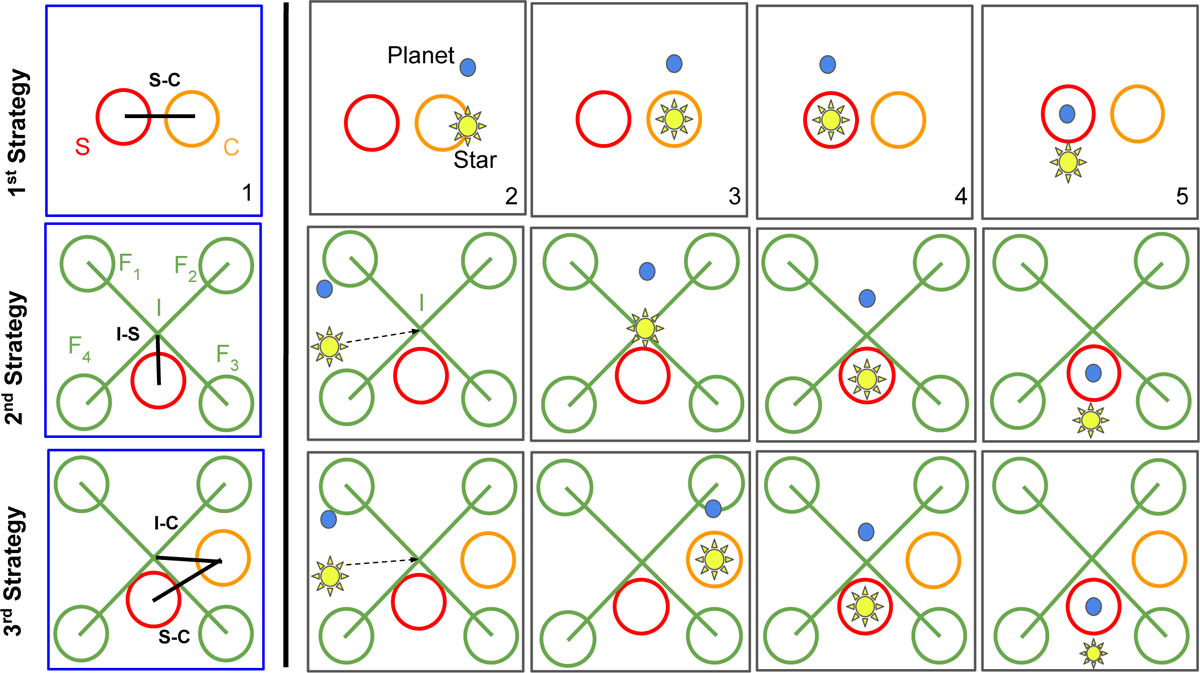
Download original image
Centring strategy schemes. Each row represents a strategy. The blue frames represent the calibration procedure for each strategy, while the black frames are assigned to the centring procedure. The panels labelled 1–5 show the steps followed to place the planet’s PSF into the science fibre.
Current usage metrics show cumulative count of Article Views (full-text article views including HTML views, PDF and ePub downloads, according to the available data) and Abstracts Views on Vision4Press platform.
Data correspond to usage on the plateform after 2015. The current usage metrics is available 48-96 hours after online publication and is updated daily on week days.
Initial download of the metrics may take a while.