Open Access
Fig. 12
Download original image
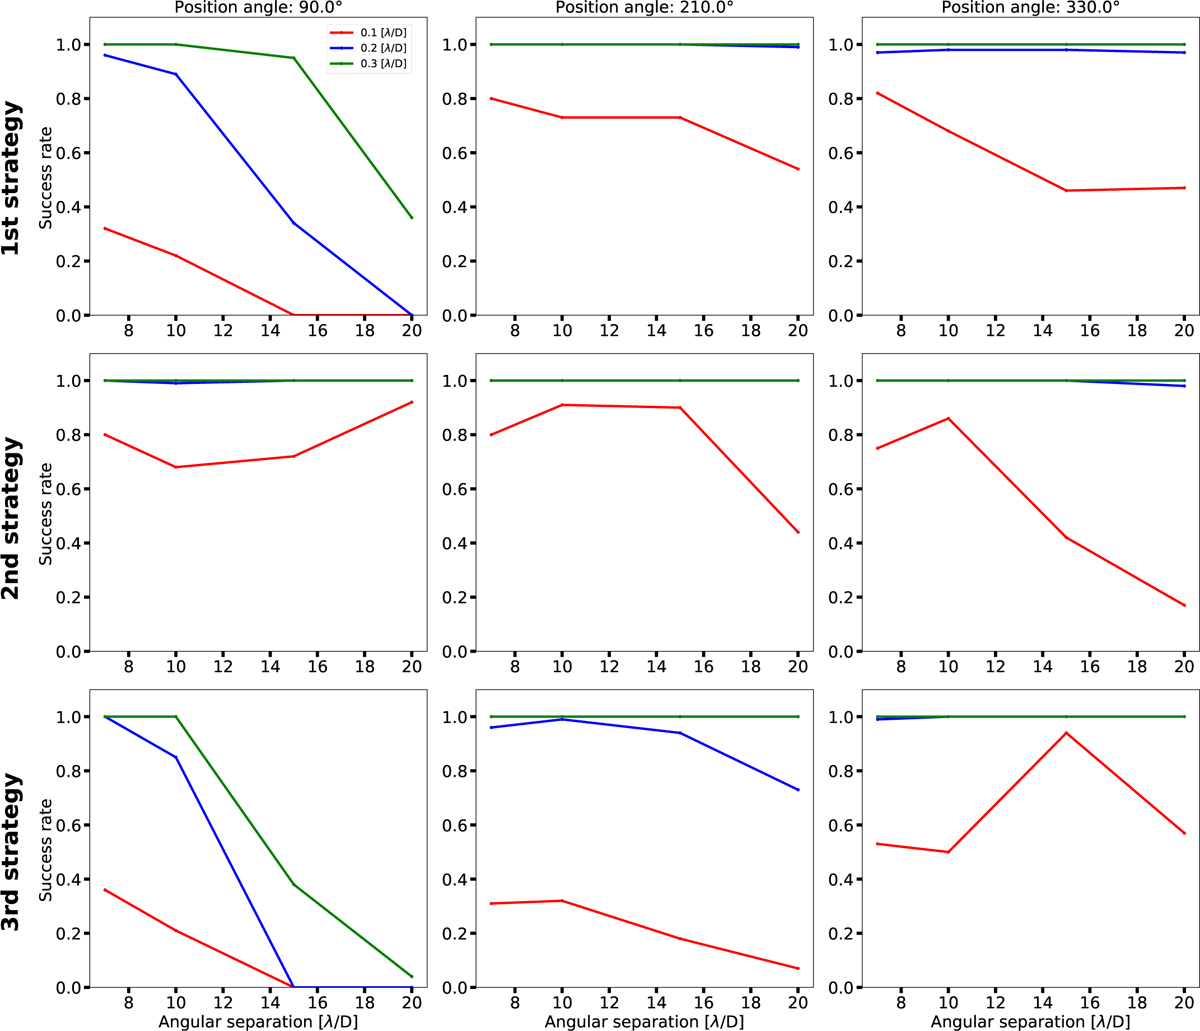
Success rate as a function of the angular separation from the star. The results for the first, second, and third strategies are plotted in the upper, middle, and lower panels, respectively. The black dashed lines at 90° and 210° represent the angles for which additional tests are performed and demonstrated in Fig. 14.
Current usage metrics show cumulative count of Article Views (full-text article views including HTML views, PDF and ePub downloads, according to the available data) and Abstracts Views on Vision4Press platform.
Data correspond to usage on the plateform after 2015. The current usage metrics is available 48-96 hours after online publication and is updated daily on week days.
Initial download of the metrics may take a while.