Fig. 10
Download original image
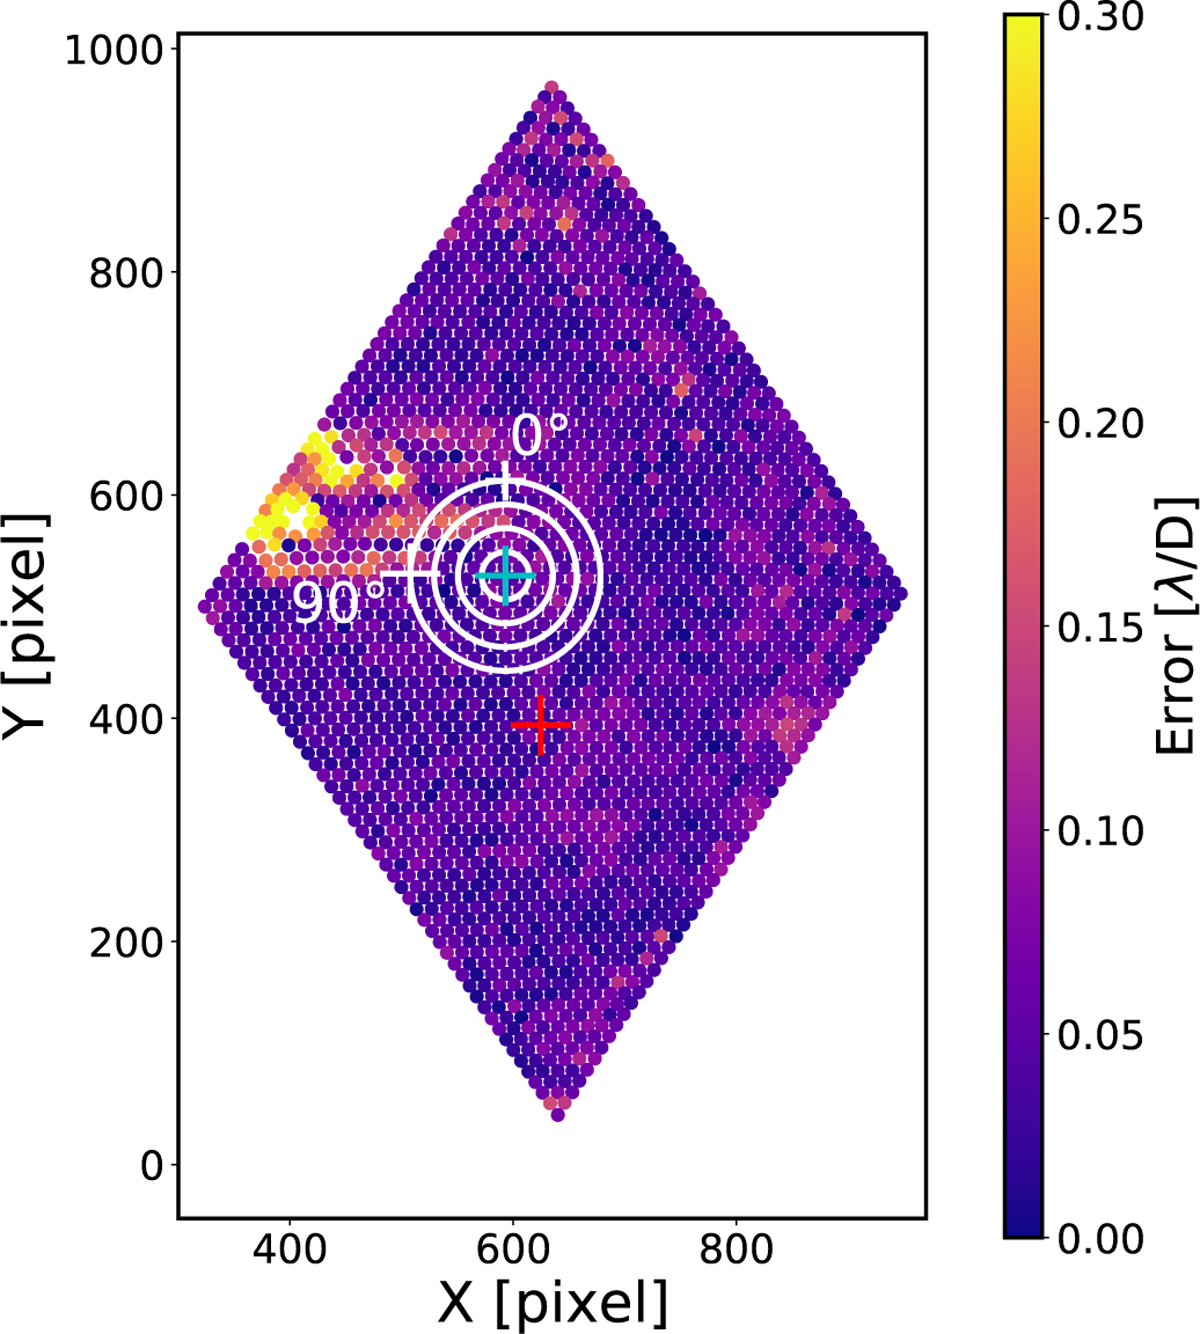
Residual of the interpolation function as measured on the tracking camera. The red cross and the blue cross give the positions of the science and centring fibre, respectively. The concentric rings in white represent the different angular separations (5, 10, 15 and 20 λ/D) and the different angle positions of the planet when the star is well centred on the centring fibre. The colour bar corresponds to the uncertainty error on the interpolation function. We note that 97.61% of the points mentioned in Fig. 9 are within the specification accuracy of 0.1 λ/D.
Current usage metrics show cumulative count of Article Views (full-text article views including HTML views, PDF and ePub downloads, according to the available data) and Abstracts Views on Vision4Press platform.
Data correspond to usage on the plateform after 2015. The current usage metrics is available 48-96 hours after online publication and is updated daily on week days.
Initial download of the metrics may take a while.