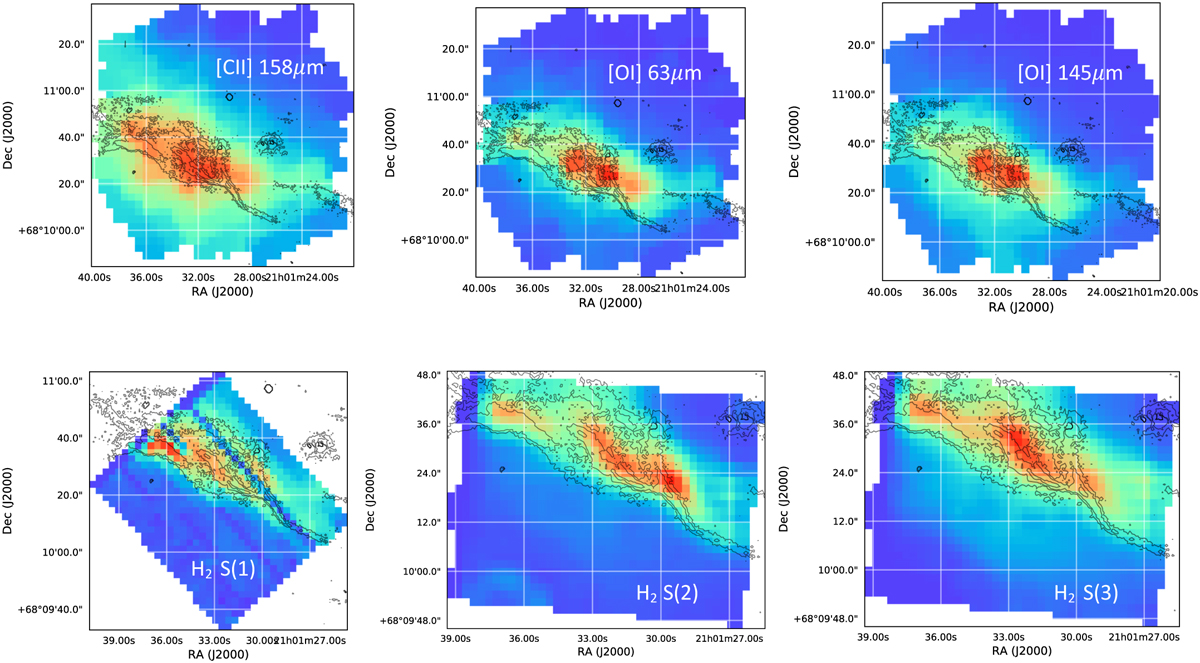
Fig. A.1
Download original image
Emission maps of gas cooling. Maps on the upper row show the [C ii] line at 158 µm, as well as the [O i] lines at 145 µm and 63 µm, which were observed with Herschel-PACS at a resolution of 11”, 8.8”, and 4.5” respectively (Bernard-Salas et al. 2015). Maps on the lower row show the emission from the H2 rotational S(1), S(2) et S(3) lines at 17.035, 12.278, and 9.7 µm, respectively. These maps were extracted from the Spitzer archival data using CUBISM Smith et al. (2007a). The S(2) and S(3) maps are from the SL module of IRS (resolution of 3.6”), and the S(1) map is from the IRS LL module (resolution of 10”). Emission from the H2 v=1-0 S(1) line at 2.121 µm is presented in contours as a spatial reference for the dissociation front, but it is not included in the cooling budget, since this line is pumped by UV photons and hence does not cool the gas.
Current usage metrics show cumulative count of Article Views (full-text article views including HTML views, PDF and ePub downloads, according to the available data) and Abstracts Views on Vision4Press platform.
Data correspond to usage on the plateform after 2015. The current usage metrics is available 48-96 hours after online publication and is updated daily on week days.
Initial download of the metrics may take a while.