Fig. 5
Download original image
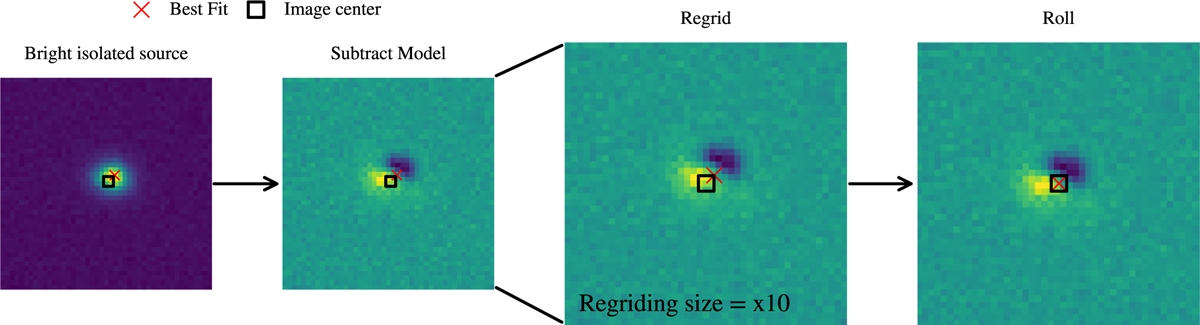
Demonstration of the steps taken to build residual table for PSF photometry. A cutout is taken around the source, and an analytical function is fitted and subtracted. The image is then resampled to a finer pixel grid (default: ×10). The residual image is then rolled (discretely shifted along x and y) such that the location of best fit is at the image centre. This is repeated for several bright isolated sources to obtain an average residual.
Current usage metrics show cumulative count of Article Views (full-text article views including HTML views, PDF and ePub downloads, according to the available data) and Abstracts Views on Vision4Press platform.
Data correspond to usage on the plateform after 2015. The current usage metrics is available 48-96 hours after online publication and is updated daily on week days.
Initial download of the metrics may take a while.