Fig. 3
Download original image
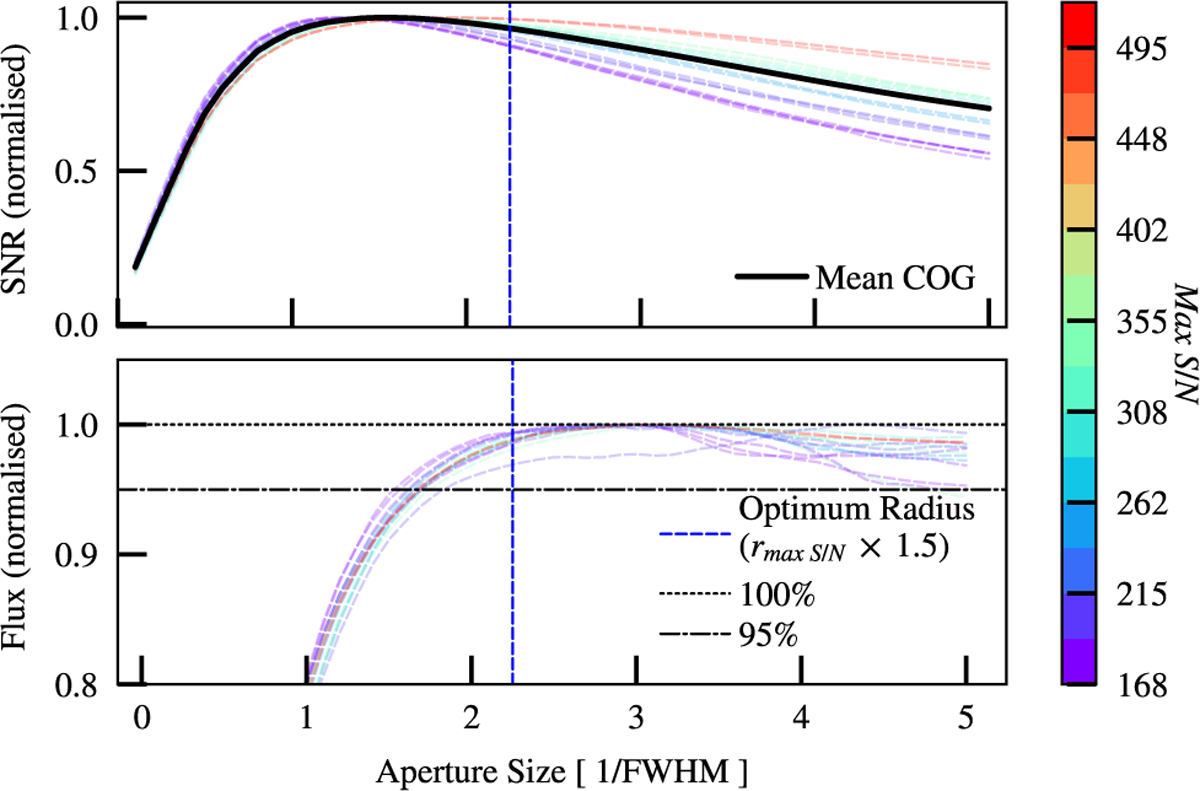
Measured S/N (enclosed flux) as a function of aperture radius for a set of sources given in upper (lower panel). For the upper panel, the mean of these curves is shown as a black solid line, while the maximum S/N of each source is indicated as per the colour bar. We note that this is consistent with the theoretical expectation from Naylor (1998). Lower panel shows the enclosed flux for a given aperture radius. We note the majority of the flux is enclosed by an aperture radius of ~2.5 × FWHM.
Current usage metrics show cumulative count of Article Views (full-text article views including HTML views, PDF and ePub downloads, according to the available data) and Abstracts Views on Vision4Press platform.
Data correspond to usage on the plateform after 2015. The current usage metrics is available 48-96 hours after online publication and is updated daily on week days.
Initial download of the metrics may take a while.