Fig. D.1

Download original image
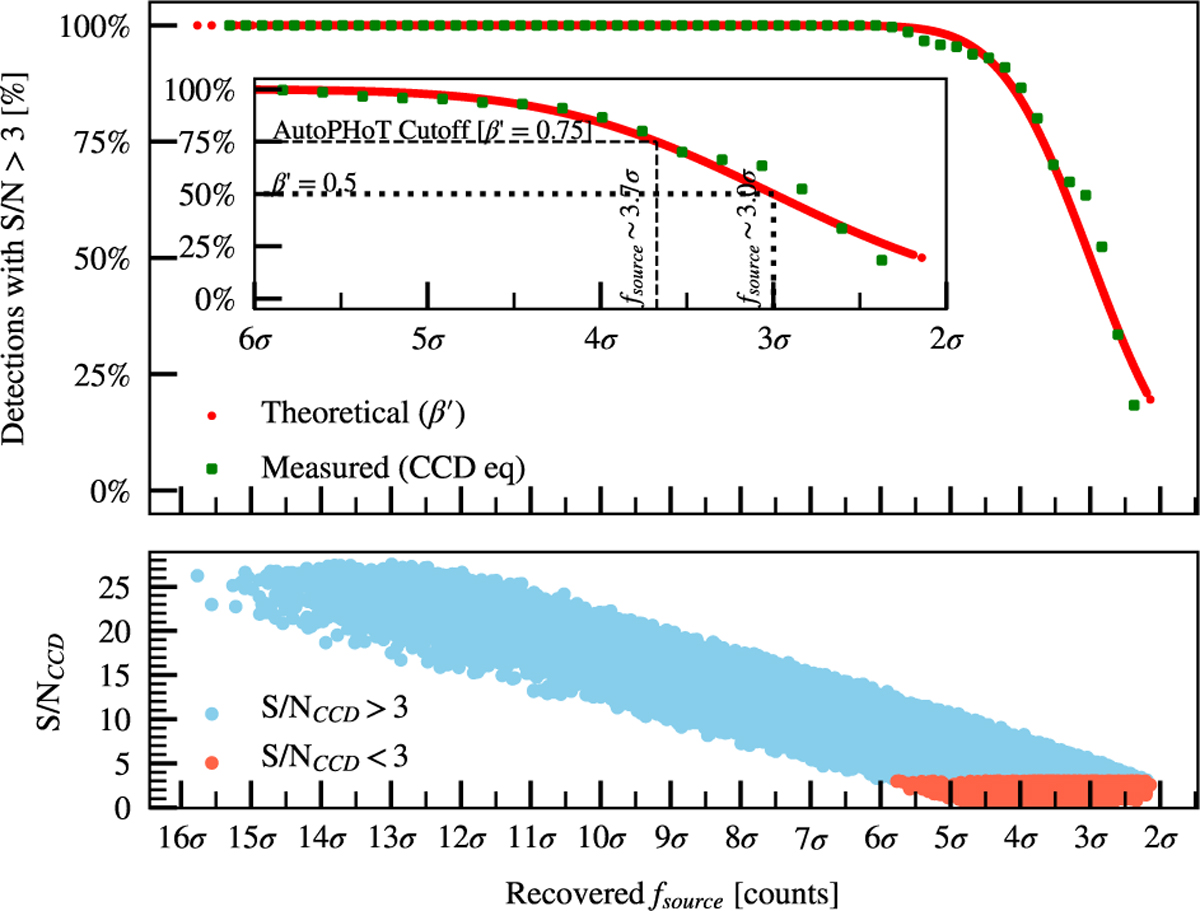
Demonstration of Eq. D.1. We perform artificial source injection on an empty patch of sky. Sources are injected uniformly throughout the image, including sub-pixel placements, with random Poisson noise added to the PSF prior to injection. In the upper panel, we plot Eq. D.1 versus maximum pixel flux in units of the standard deviation of the background noise, as the red curve. The green points show the binned S/N ratio using Eq. B.3. In the lower panel, we plot the S/N ratio using Eq. B.3 with the same x-axis as the upper panel. The points are coloured blue if S/N > 3 and red if S/N < 3. For the sample of sources incrementally injected, Eq. D.1 can reproduce the recovered fraction of sources. In other words, for sources measured with a fsource ≈ ~3σbkg, roughly half of these are recovered with a S/N > 3; for injected sources with fsource ≈ 3.7σbkg we detect roughly 75 %; while virtually all sources are confidently recovered at fsource ≈ 4.5σbkg
Current usage metrics show cumulative count of Article Views (full-text article views including HTML views, PDF and ePub downloads, according to the available data) and Abstracts Views on Vision4Press platform.
Data correspond to usage on the plateform after 2015. The current usage metrics is available 48-96 hours after online publication and is updated daily on week days.
Initial download of the metrics may take a while.


