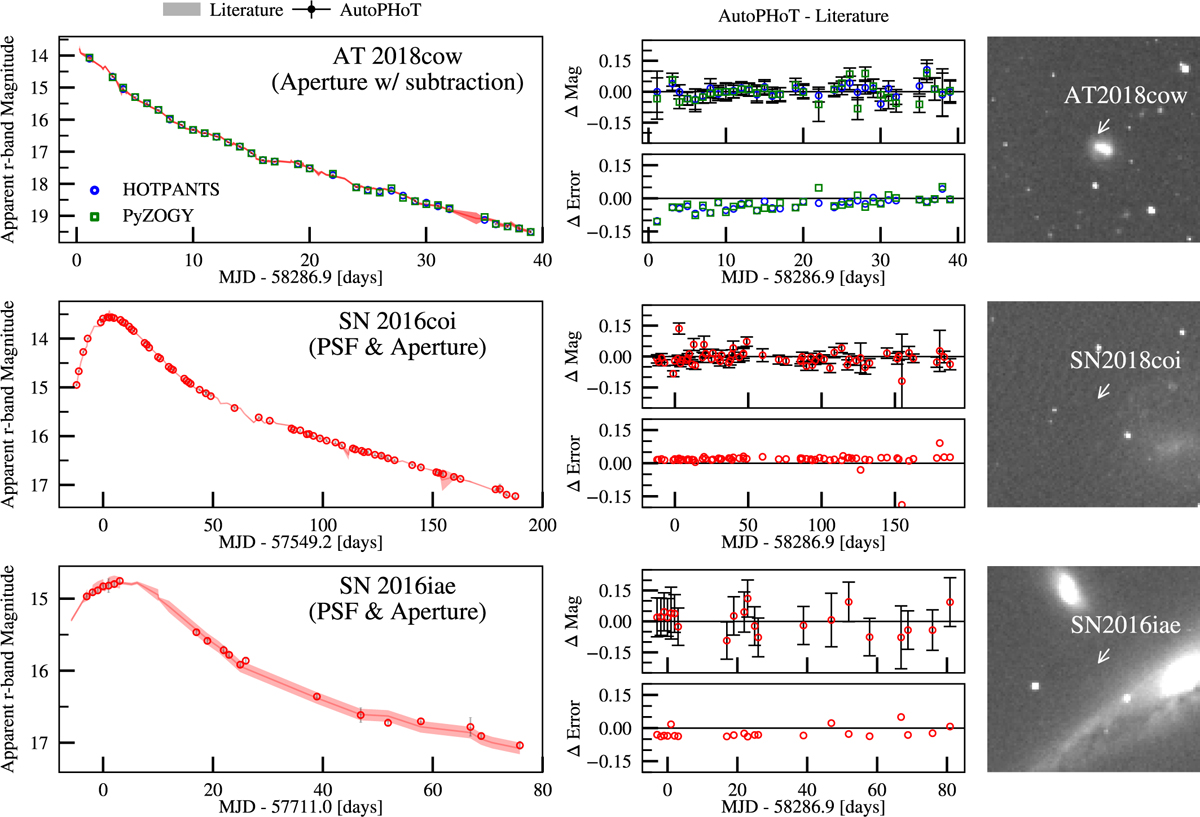
Fig. 17

Download original image
r-band light curves produced by AutoPhOT compared to those found in literature. AutoPhOT points are given as points with error bars, and literature values given as a shaded band with a width equal to the error at each point. In descending order, we compare the output from AutoPhOT for AT 2018cow (Perley et al. 2018; Prentice et al. 2018b) using template subtraction and aperture photometry, SN 2016coi (Prentice et al. 2018a) and SN 2016iae (Prentice & Mazzali 2017) without subtraction using both PSF and aperture photometry. We also compare the results using PyZogy for template subtraction in the case of AT 2018cow. Centre panels compare both cases, with the upper panel showing the difference between measurements (∆ Mag = AutoPhOTliterature) and lower panel showing the difference in error (∆ Magerr = AutoPhOTerrliteratureerr) for each transient. Right panels highlight the site of the transient event.
Current usage metrics show cumulative count of Article Views (full-text article views including HTML views, PDF and ePub downloads, according to the available data) and Abstracts Views on Vision4Press platform.
Data correspond to usage on the plateform after 2015. The current usage metrics is available 48-96 hours after online publication and is updated daily on week days.
Initial download of the metrics may take a while.


