Fig. 16
Download original image
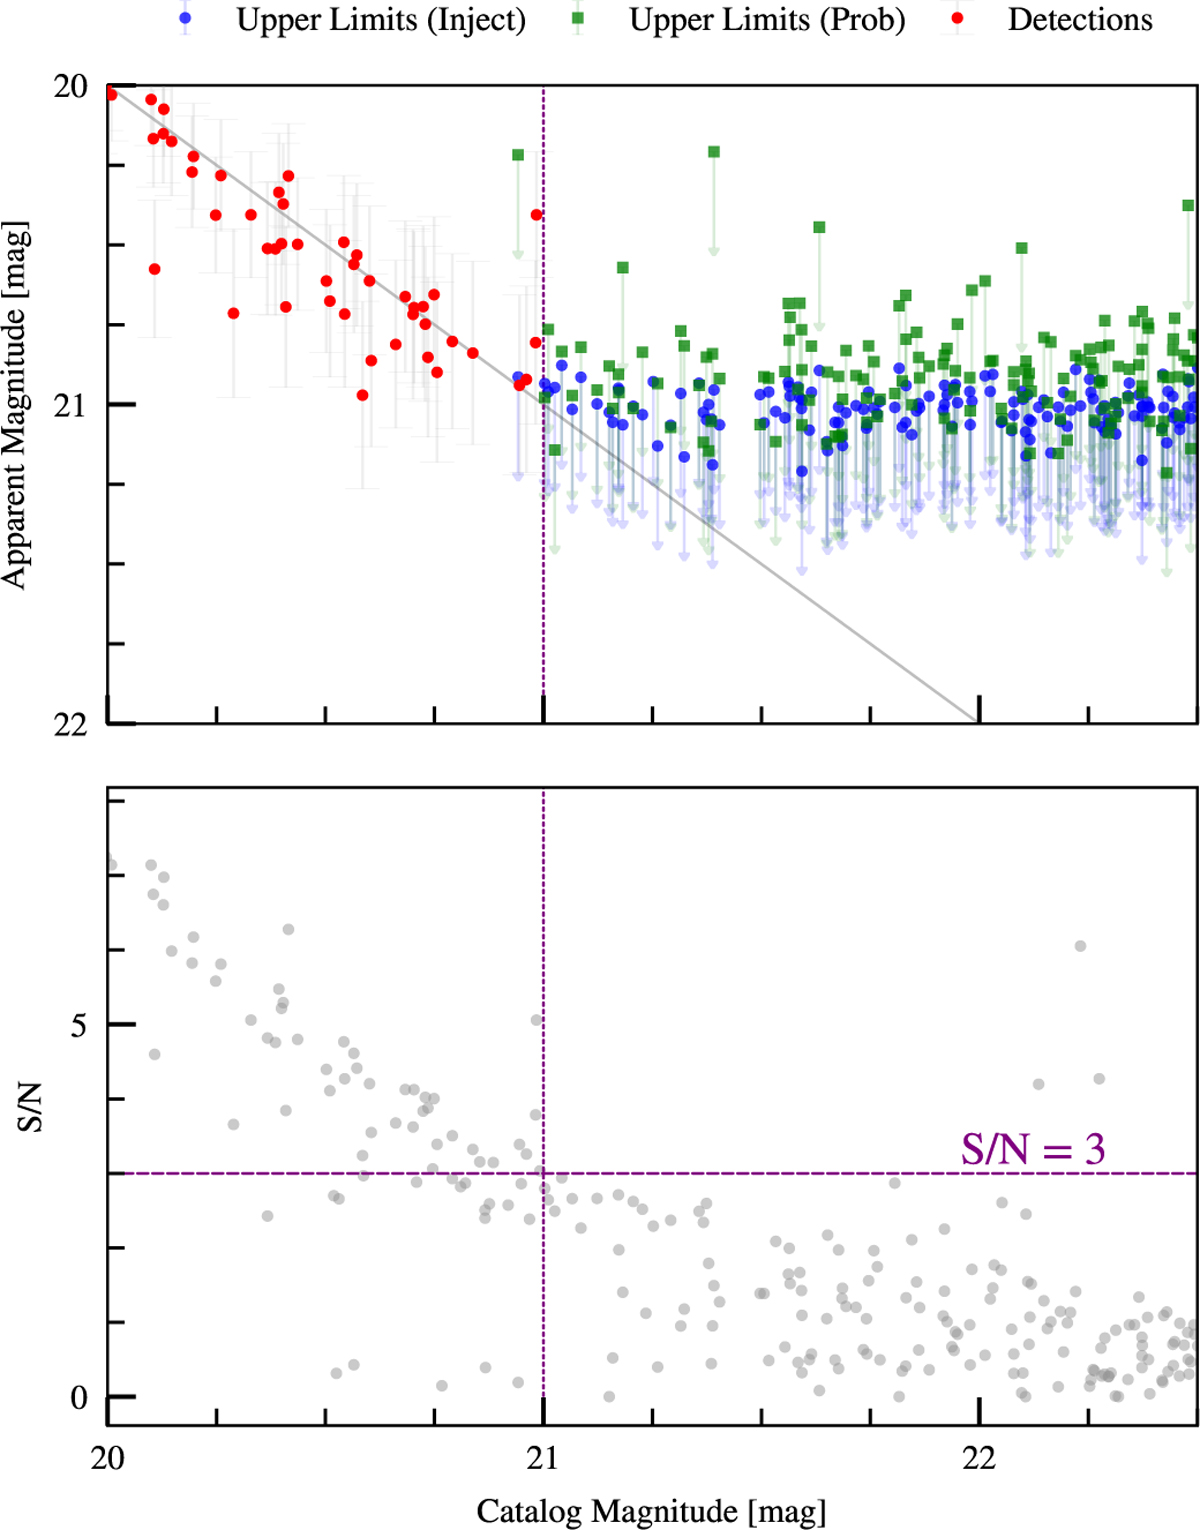
Comparison of the probable limiting magnitude and that found from artificial source injection. Upper panel: magnitude of recovered source versus its catalogue magnitude. If a source is recovered, it is plotted as the red marker. If the source is not recovered, we plot the limiting magnitude at the source’s position as the green marker (probable limiting magnitude) and blue marker (artificial source injection). Lower panel: S/N at the position of the source.
Current usage metrics show cumulative count of Article Views (full-text article views including HTML views, PDF and ePub downloads, according to the available data) and Abstracts Views on Vision4Press platform.
Data correspond to usage on the plateform after 2015. The current usage metrics is available 48-96 hours after online publication and is updated daily on week days.
Initial download of the metrics may take a while.