Fig. 13
Download original image
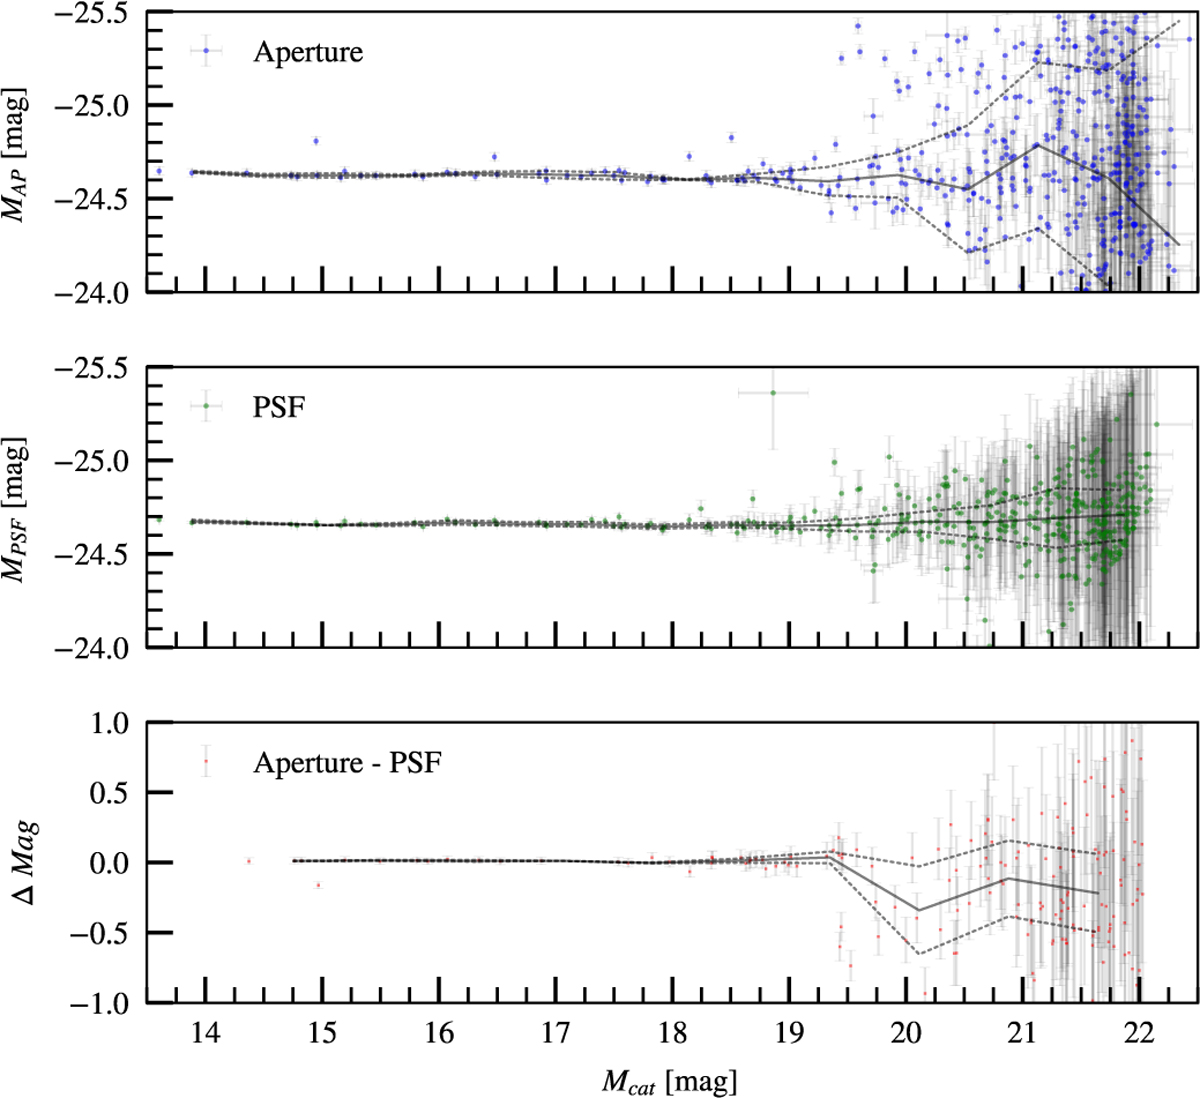
Demonstration of recovered magnitude using aperture photometry (upper panel) and the PSF-fitting package (middle panel) from AutoPhOT. The F-axis shoes the derived zeropoint magnitude for each source. The bottom panel shows the difference between aperture and PSF-fitting photometry for this particular image. Solid lines show a moving mean value, with dashed lines indicating the standard deviation in each bin. Horizontal error bars show the uncertainty on catalogue magnitudes, vertical error bars are uncertainties on recovered magnitudes from AutoPhOT.
Current usage metrics show cumulative count of Article Views (full-text article views including HTML views, PDF and ePub downloads, according to the available data) and Abstracts Views on Vision4Press platform.
Data correspond to usage on the plateform after 2015. The current usage metrics is available 48-96 hours after online publication and is updated daily on week days.
Initial download of the metrics may take a while.