Fig. 12
Download original image
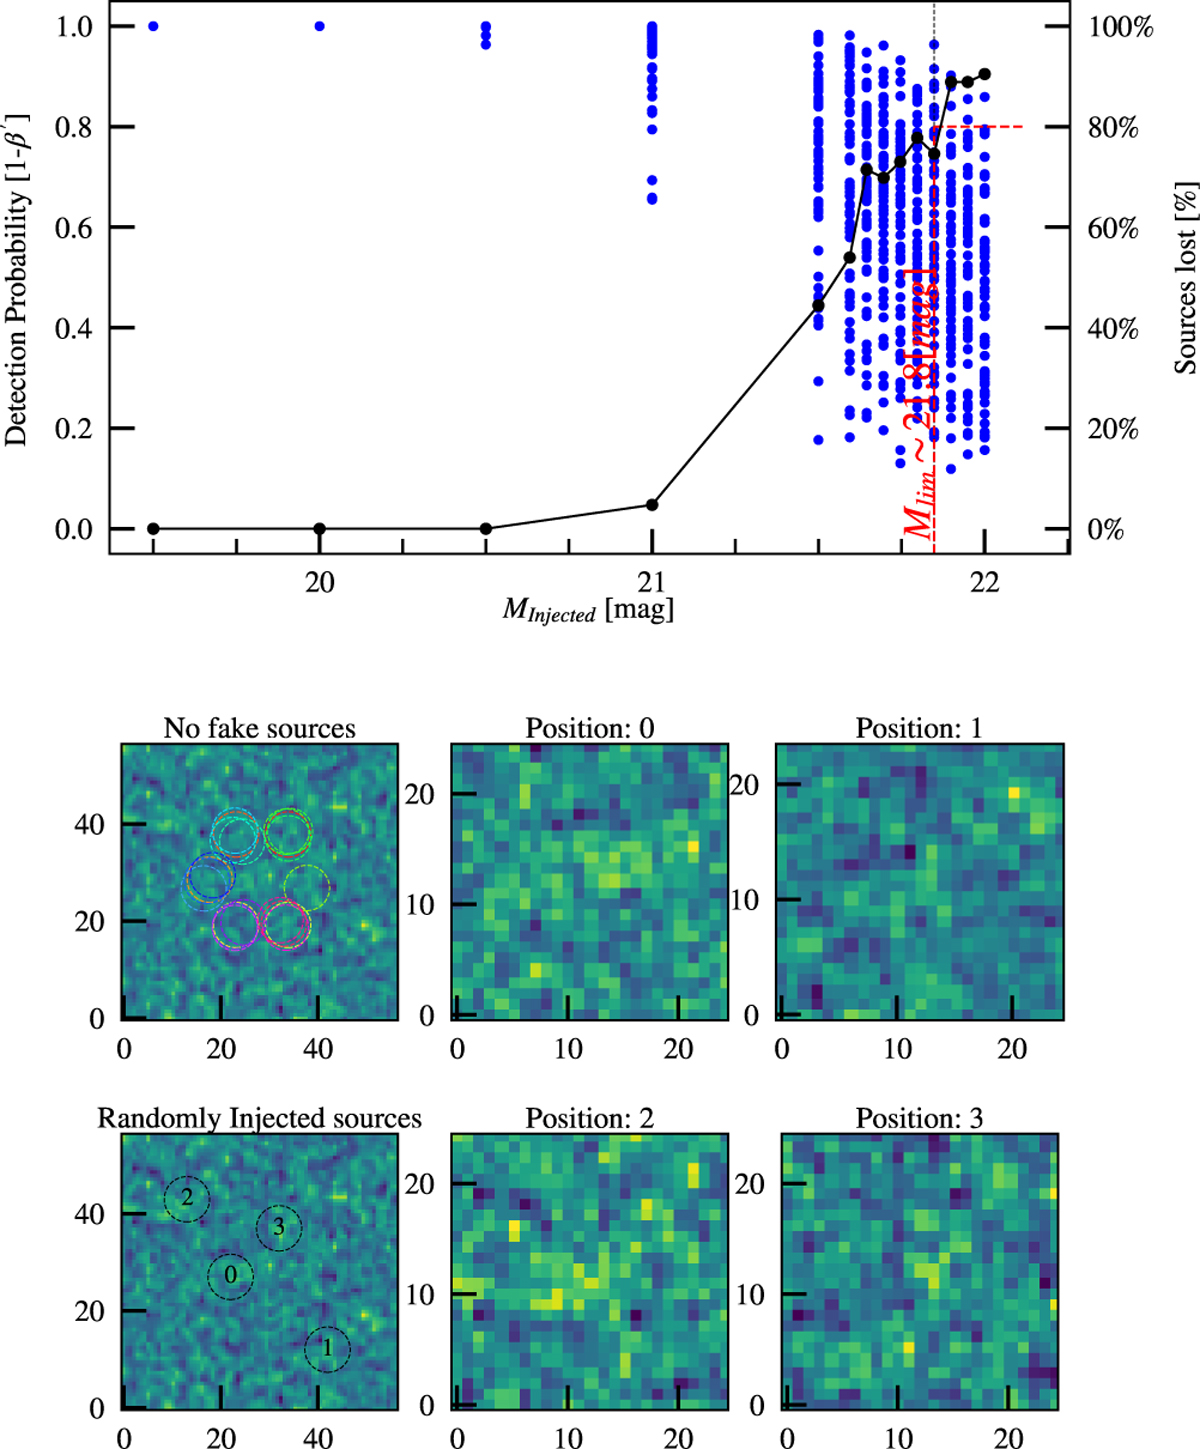
Diagnostic plot from AutoPhOT’s artificial source injection package. Top panel shows the change in the detection probability (1 − β′) for artificially injected sources. In this example, the sources are considered lost at β = 0.75 and the detection cutoff is reached when 80% of sources are lost (black line with circles). The leftmost image cutouts illustrate locations around the target location before (upper) and after (lower) sources were injected randomly at the limiting magnitude. The remaining four panels demonstrate closes up of these injected sources.
Current usage metrics show cumulative count of Article Views (full-text article views including HTML views, PDF and ePub downloads, according to the available data) and Abstracts Views on Vision4Press platform.
Data correspond to usage on the plateform after 2015. The current usage metrics is available 48-96 hours after online publication and is updated daily on week days.
Initial download of the metrics may take a while.