Fig. 11
Download original image
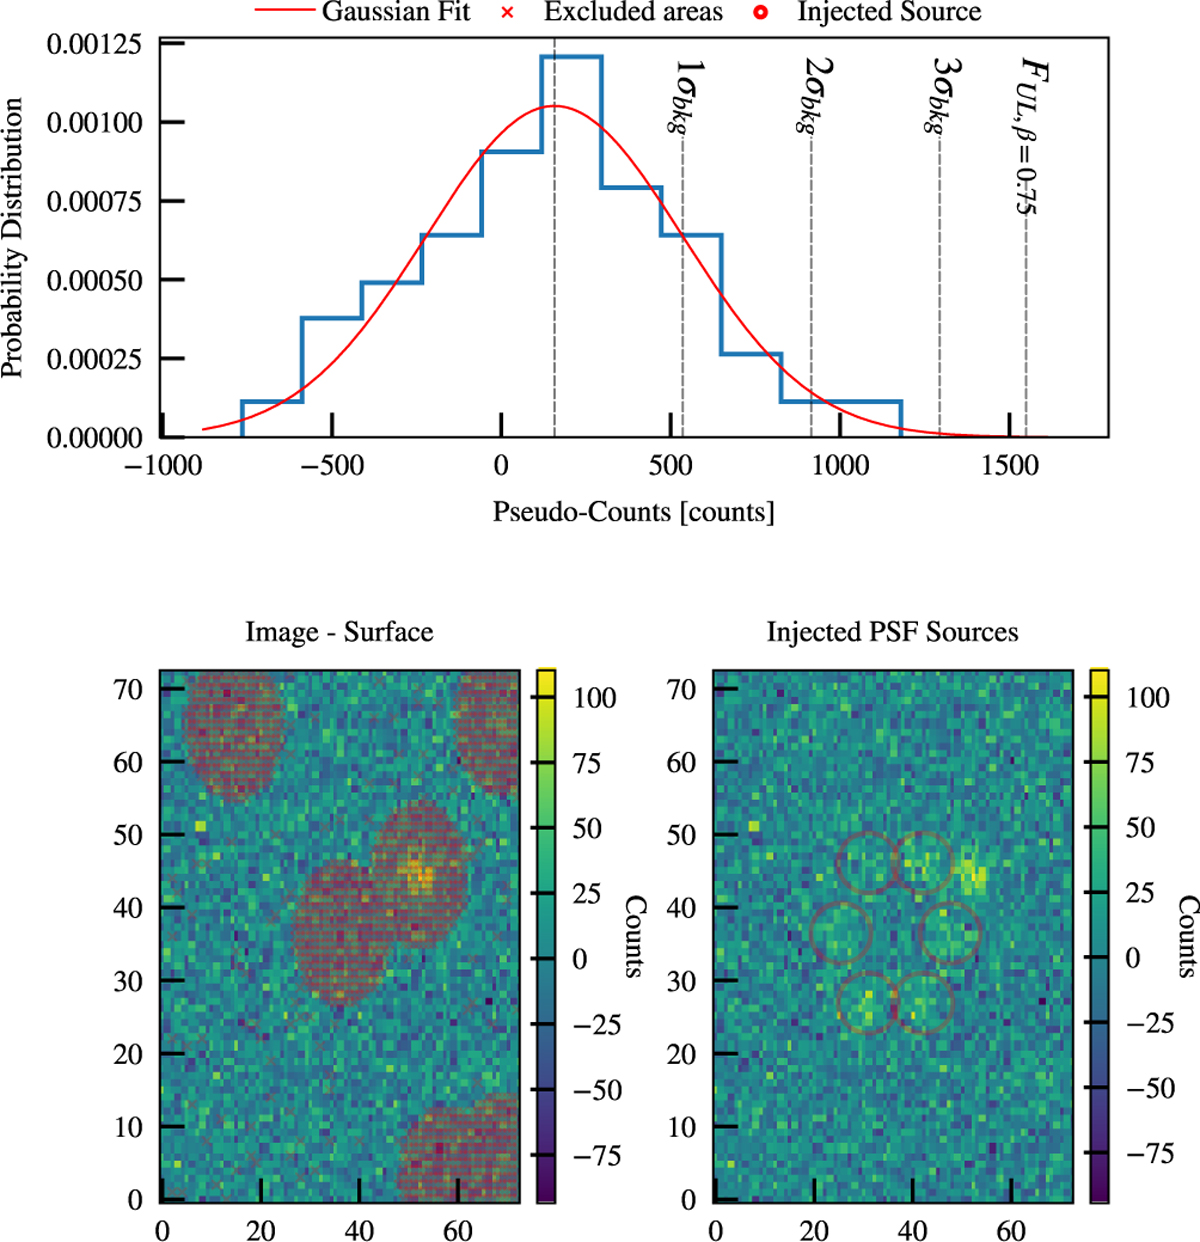
Demonstration of probabilistic limiting magnitude measurement. The upper panel shows the distribution of summed counts for a random set of pixels close to the expected source location. Bottom left panel shows a cutout of the transient location; pixels marked in red are excluded when creating the distribution; note the source off-centre is masked. Bottom right panel is the same image with injected PSF sources (marked with red circles) with magnitude equal to the Ful,β=0.75 limiting magnitude (see Appendix D).
Current usage metrics show cumulative count of Article Views (full-text article views including HTML views, PDF and ePub downloads, according to the available data) and Abstracts Views on Vision4Press platform.
Data correspond to usage on the plateform after 2015. The current usage metrics is available 48-96 hours after online publication and is updated daily on week days.
Initial download of the metrics may take a while.