Open Access
Fig. 5
Download original image
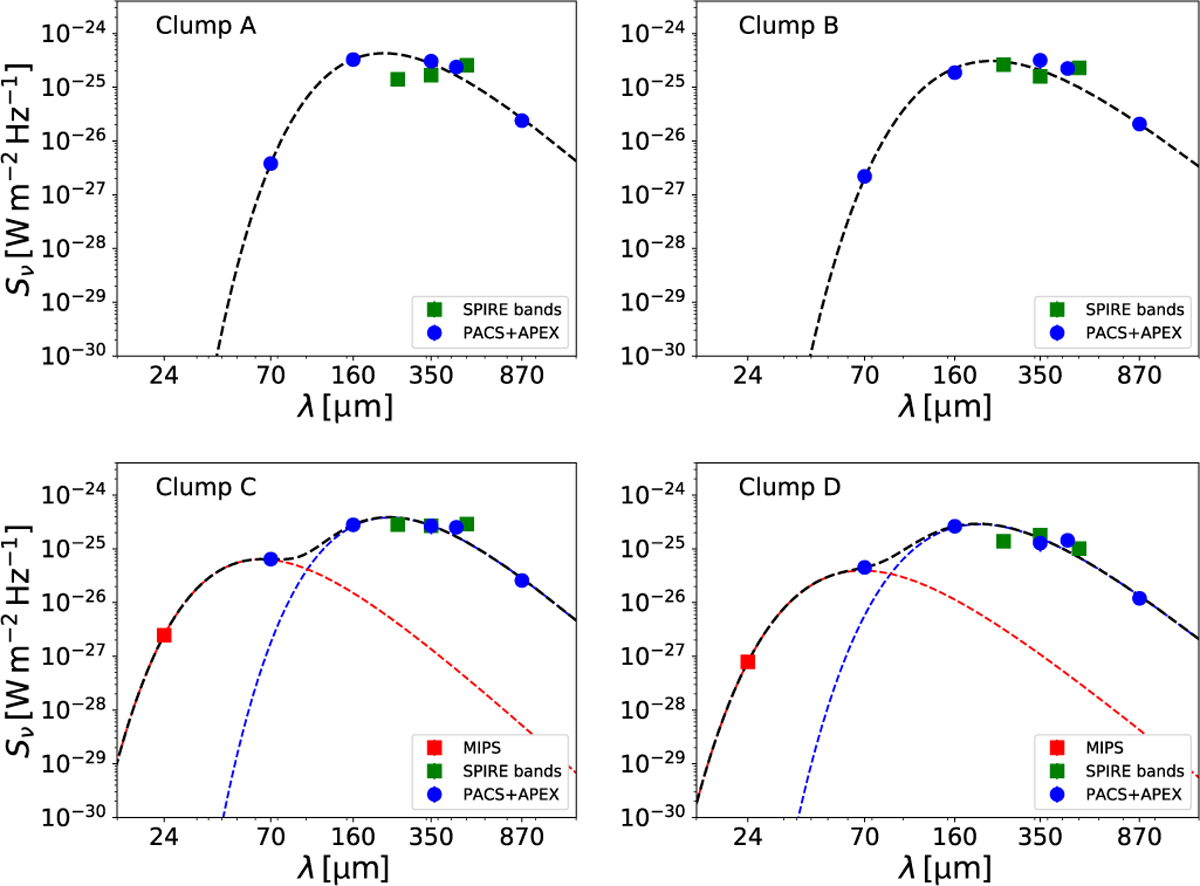
Mid-IR to submillimetre SEDs of the clumps in G11.36+0.80. The Spitzer/MIPS 24 µm data points are highlighted in red. For the two-temperature MBB fits (clumps C and D), the dashed black line shows the sum of the two components. The dashed blue and red lines show the SED fits to the cold and warm component, respectively.
Current usage metrics show cumulative count of Article Views (full-text article views including HTML views, PDF and ePub downloads, according to the available data) and Abstracts Views on Vision4Press platform.
Data correspond to usage on the plateform after 2015. The current usage metrics is available 48-96 hours after online publication and is updated daily on week days.
Initial download of the metrics may take a while.