Open Access
Fig. 4
Download original image
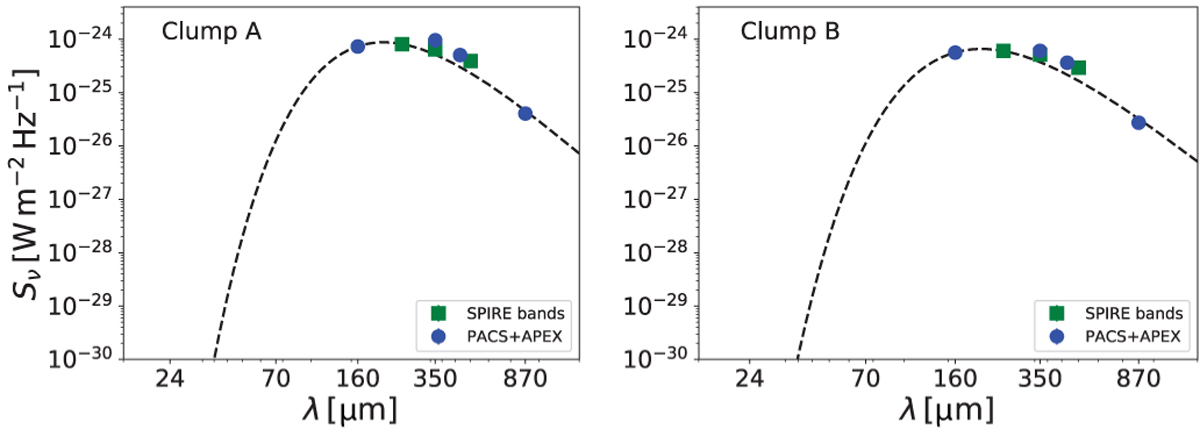
Far-IR to submillimetre SEDs of the clumps in G1.75-0.08. The SPIRE data points shown by square green symbols are plotted for comparison, and they were not included in the fit (see Sect. 3.3 for details). The dashed black lines represent the best MBB fits to the data.
Current usage metrics show cumulative count of Article Views (full-text article views including HTML views, PDF and ePub downloads, according to the available data) and Abstracts Views on Vision4Press platform.
Data correspond to usage on the plateform after 2015. The current usage metrics is available 48-96 hours after online publication and is updated daily on week days.
Initial download of the metrics may take a while.