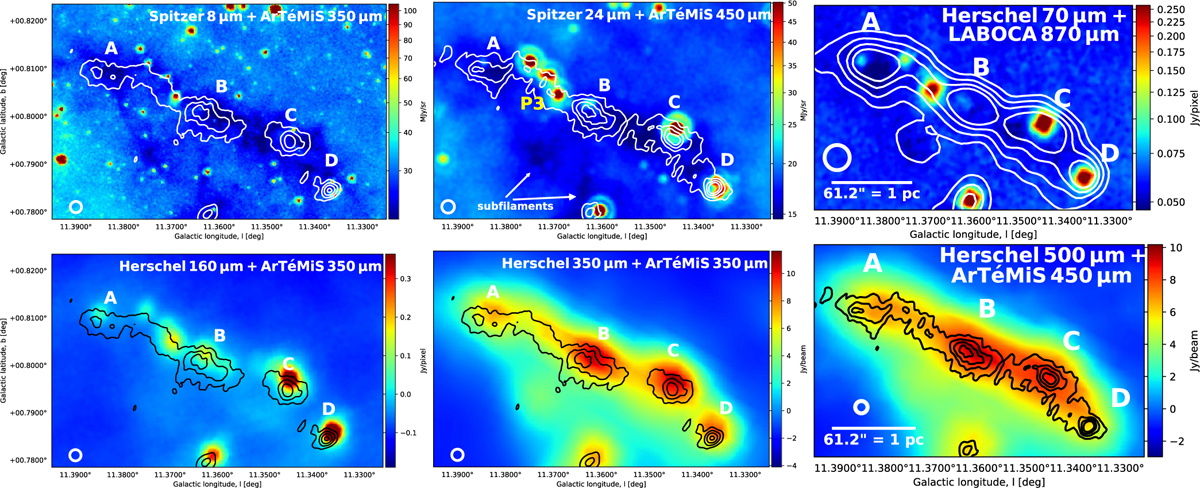
Fig. 2
Download original image
Same as Fig. 1, but towards G11.36+0.80. All the contour levels start from 3σ and progress in steps of 3σ. A source from the Feng et al. (2020) sample, G11.38+0.81 P3, is labelled P3 in the Spitzer 24 µm plus ArTéMiS 450 µm image. The 24 µm dark features to the south of clump B are also indicated in this image. We call them subfilaments.
Current usage metrics show cumulative count of Article Views (full-text article views including HTML views, PDF and ePub downloads, according to the available data) and Abstracts Views on Vision4Press platform.
Data correspond to usage on the plateform after 2015. The current usage metrics is available 48-96 hours after online publication and is updated daily on week days.
Initial download of the metrics may take a while.