Fig. 1
Download original image
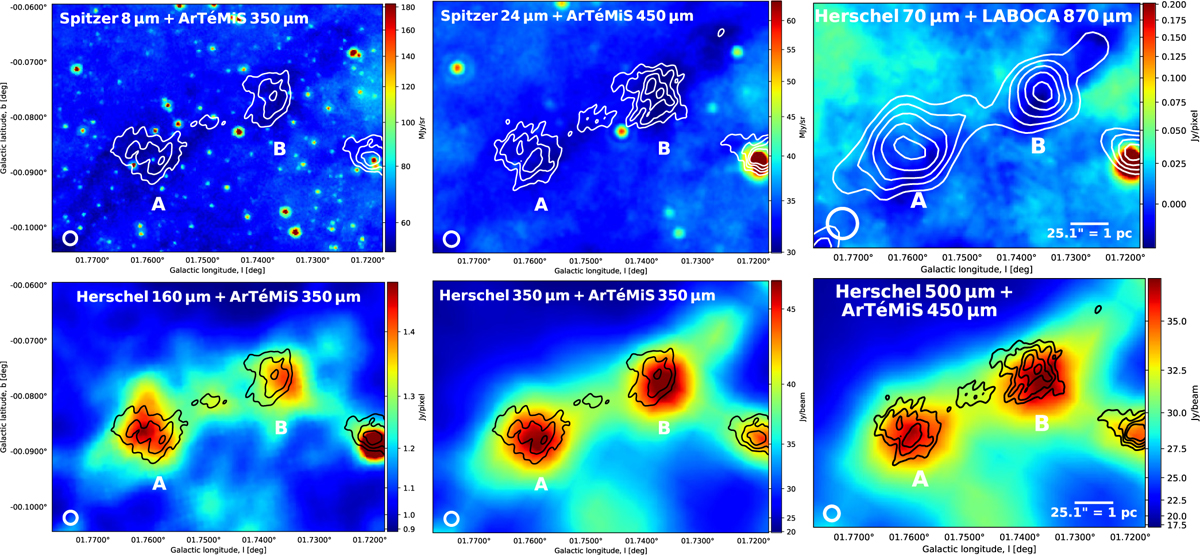
Multi-wavelength images towards Gl.75-0.08. Top panels: colour images from left to right show the Spitzer/IRAC 8, Spitzer/MIPS 24, and Herschel/PACS 70 µm maps. The overlaid contours show the ArTéMiS 350, ArTéMiS 450, and LABOCA 870 µm emission, respectively. In each case, the contour levels start from 3σ and progress in steps of 1σ. Bottom panels: colour images from left to right show the Herschel/PACS 160, Herschel/SPIRE 350, and Herschel/SPIRE 500 µm maps. The first two are overlaid with the ArTéMiS 350 µm contours, while the rightmost map is overlaid with the ArTéMiS 450 µm contours. The beam sizes (HPBW) of the APEX bolometer observations are shown in the bottom left corner of each panel. A scale bar of 1 pc is shown in the right panels.
Current usage metrics show cumulative count of Article Views (full-text article views including HTML views, PDF and ePub downloads, according to the available data) and Abstracts Views on Vision4Press platform.
Data correspond to usage on the plateform after 2015. The current usage metrics is available 48-96 hours after online publication and is updated daily on week days.
Initial download of the metrics may take a while.