Fig. 5.

Download original image
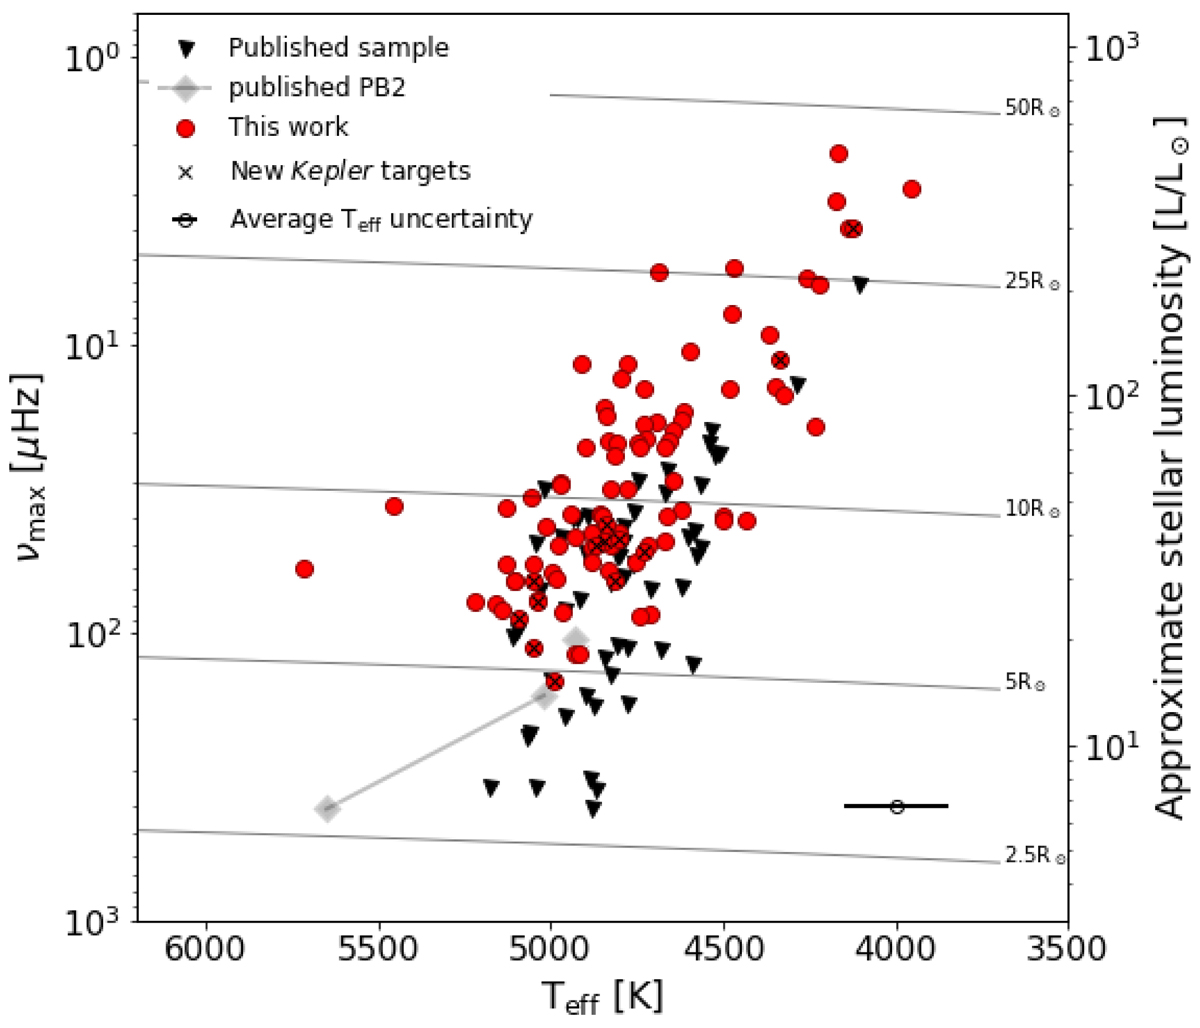
Distribution of the sample of binary systems hosting evolved stars as their primary stellar component. Red dots mark systems seismically characterised in this study. Systems from the published Kepler sample with an oscillating RG primary are depicted as black triangles. Systems hosting two oscillating RG components (PB2) are shown as grey diamonds. The background density plot represents the distribution of all 4004 systems for which the SB9 (Pourbaix et al. 2004) reports orbital solutions. The grey and black contour lines engulf the regions with 3 and 6.5 times the median density of a bin. The light-blue lines indicate the arcs of constant angular momentum in the e–P plane for circular orbital periods for 1, 10, 100, 1000, and 10 000 days. The vertical yellow lines indicate the time-span covered by TESS and Kepler. The horizontal black lines indicate the range of eccentricities that are not generally found in systems with periods shorter than 200 d.
Current usage metrics show cumulative count of Article Views (full-text article views including HTML views, PDF and ePub downloads, according to the available data) and Abstracts Views on Vision4Press platform.
Data correspond to usage on the plateform after 2015. The current usage metrics is available 48-96 hours after online publication and is updated daily on week days.
Initial download of the metrics may take a while.


