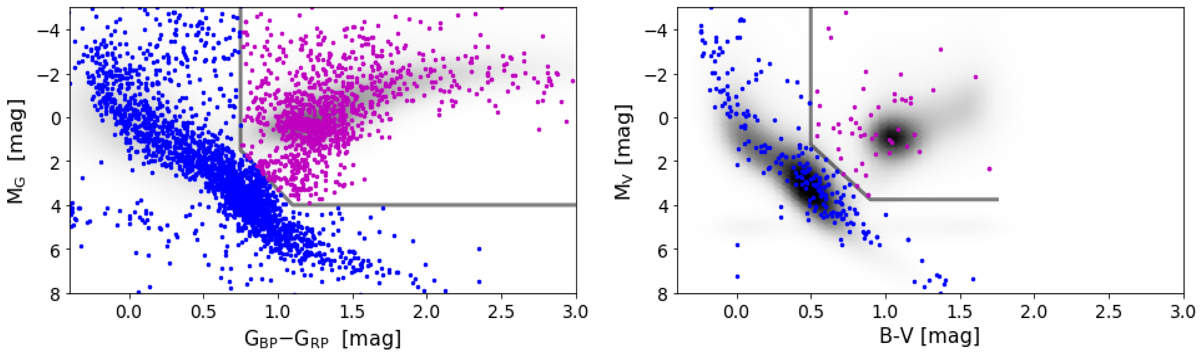
Fig. 1.
Download original image
Colour–magnitude diagrams depicting the positions of the systems listed in the SB9 catalogue using Gaia DR2 (left) and HIPPARCOS astrometry (right panel). Magenta dots indicate candidates of hosting primaries in advanced phases of stellar evolution. Blue dots mark the remaining systems. The grey line indicates the selection criterion for red-giant candidates. The background density plots represent the distribution of all stars measured by the respective mission, with a limiting magnitude in V of 10 mag.
Current usage metrics show cumulative count of Article Views (full-text article views including HTML views, PDF and ePub downloads, according to the available data) and Abstracts Views on Vision4Press platform.
Data correspond to usage on the plateform after 2015. The current usage metrics is available 48-96 hours after online publication and is updated daily on week days.
Initial download of the metrics may take a while.