Open Access
Fig. B.2
Download original image
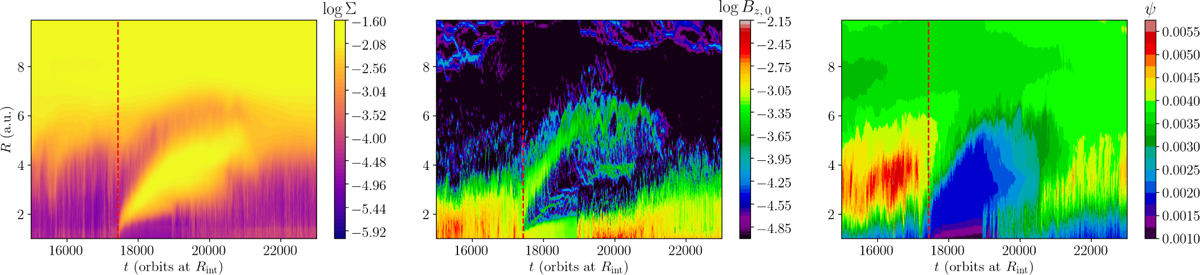
Spatio-temporal diagrams of Σ (first panel), Bz,0 the vertical magnetic field at the midplane and ψ the flux function defined in Eq. 39, for simulation B5Bin0Am0. These profiles focus on the second burst detected in the left panels of Fig. 21. The red dashed line marks the beginning of the burst when detected using Σ.
Current usage metrics show cumulative count of Article Views (full-text article views including HTML views, PDF and ePub downloads, according to the available data) and Abstracts Views on Vision4Press platform.
Data correspond to usage on the plateform after 2015. The current usage metrics is available 48-96 hours after online publication and is updated daily on week days.
Initial download of the metrics may take a while.