Fig. 17
Download original image
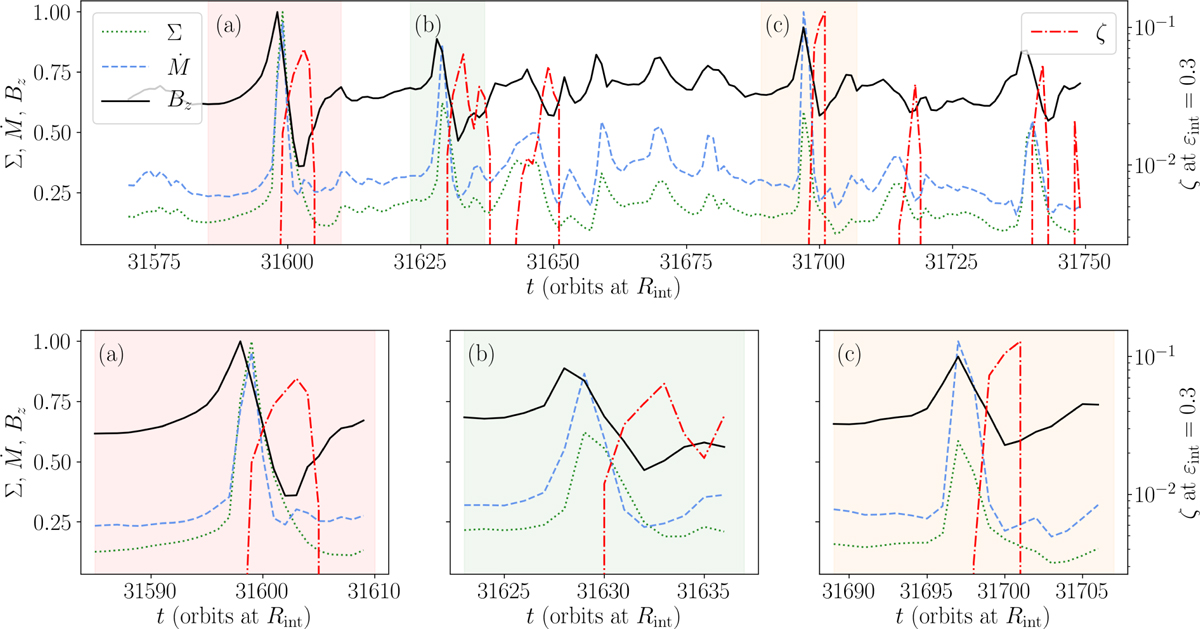
Temporal evolution of Σ in dotted green, Ṁ in dashed blue, and Bz (vertically averaged) in black (full line) at R = 3 au for the fiducial simulation. ζ is calculated at ɛint = 0.3 and shown by a semi-dashed red line with a logarithmic scale on the right of the panels. Apart from ζ, all the profiles are given in arbitrary units and divided by their maximum value reached during the timescale of the top panel.
Current usage metrics show cumulative count of Article Views (full-text article views including HTML views, PDF and ePub downloads, according to the available data) and Abstracts Views on Vision4Press platform.
Data correspond to usage on the plateform after 2015. The current usage metrics is available 48-96 hours after online publication and is updated daily on week days.
Initial download of the metrics may take a while.