Open Access
Fig. 5.
Download original image
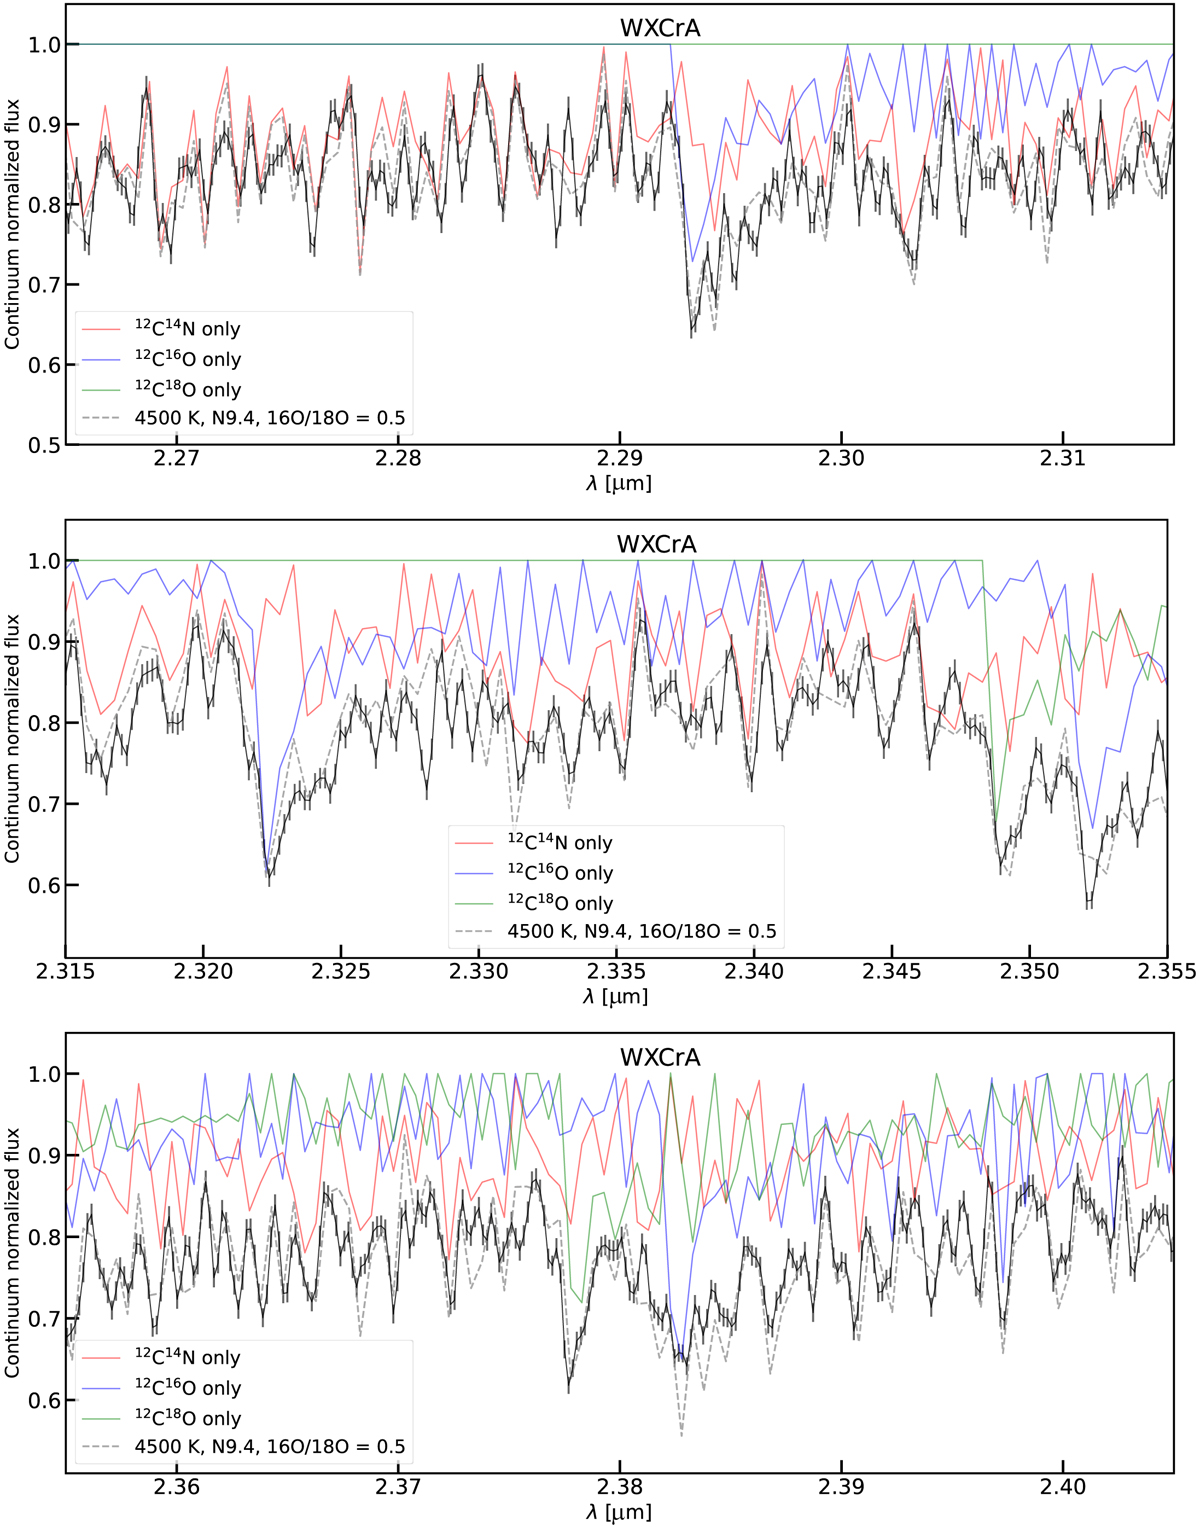
Zoom-in of the spectra of the RCB star WXCrA (solid black line). We plot the best fit-model synthetic spectrum to this star (gray, dashed line), and show the contribution of 12C14N (solid red), 12C16O blue and 12C18O green. The top, middle and bottom panels show different spectral regions.
Current usage metrics show cumulative count of Article Views (full-text article views including HTML views, PDF and ePub downloads, according to the available data) and Abstracts Views on Vision4Press platform.
Data correspond to usage on the plateform after 2015. The current usage metrics is available 48-96 hours after online publication and is updated daily on week days.
Initial download of the metrics may take a while.