Fig. 4.
Download original image
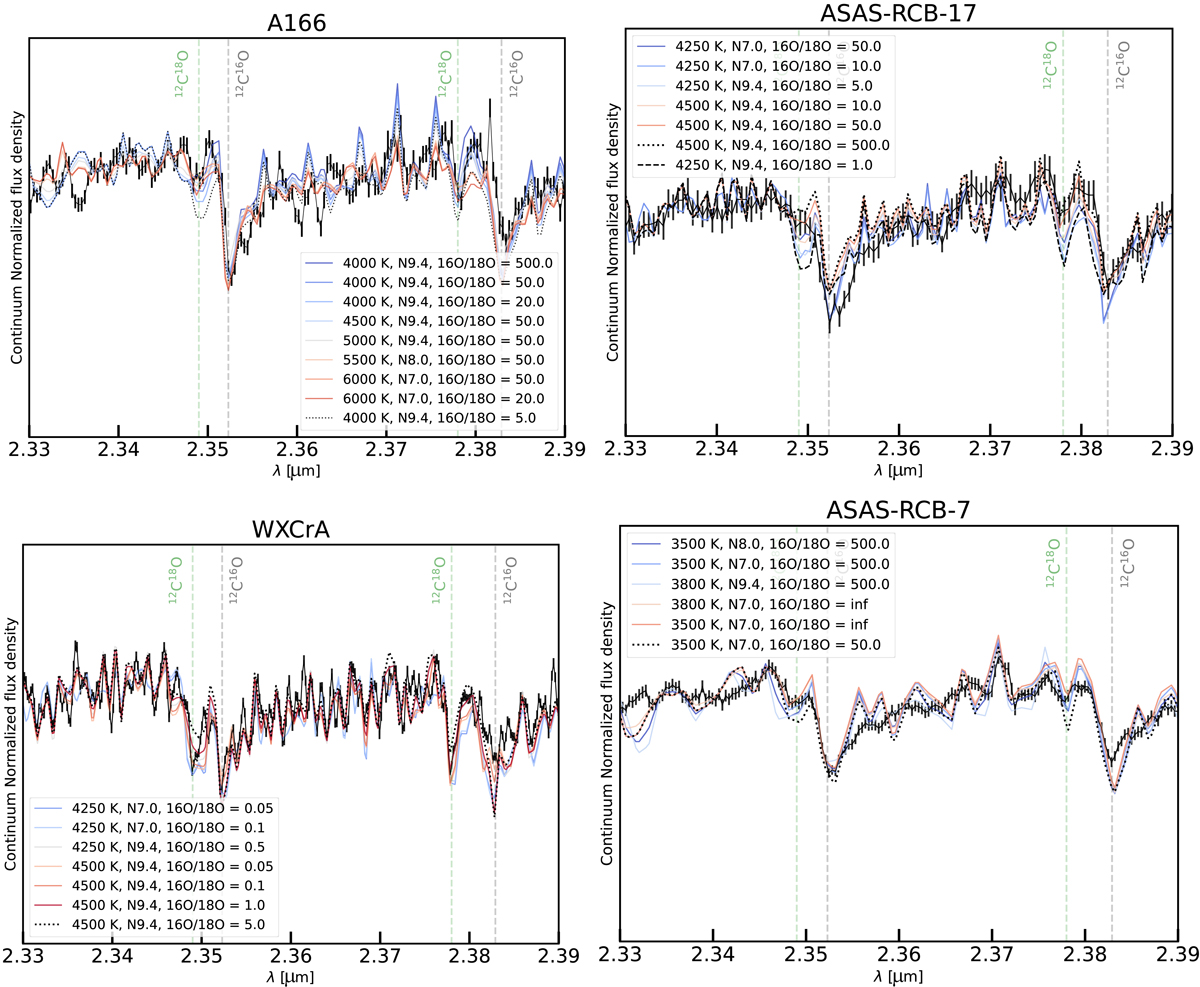
Model fits to the CO absorption bandheads of the dLHdC star A166 and RCB stars ASAS-RCB-17, WXCrA and ASAS-RCB-7. The spectra (with errorbars) are plotted in black, and the best-fit models for a wide allowed range of model parameters (Table 2) are plotted as solid colored lines. The measured 16O/18O for these stars are > 20, 5 − 50, 0.05 − 1 and > 500 respectively. The dotted and dashed lines show models with oxygen isotope ratios outside these derived ranges (16O/18O = 10 for A166, 1 and 500 for ASAS-RCB-17, and 5 for WXCrA). It is challenging to distinguish between models with different N abundances given the medium resolution and S/N of the spectra. We focus on the regions around the 12C18O and 12C16O bandheads (dashed green and gray lines) and report the range of values consistent with the observed spectra.
Current usage metrics show cumulative count of Article Views (full-text article views including HTML views, PDF and ePub downloads, according to the available data) and Abstracts Views on Vision4Press platform.
Data correspond to usage on the plateform after 2015. The current usage metrics is available 48-96 hours after online publication and is updated daily on week days.
Initial download of the metrics may take a while.