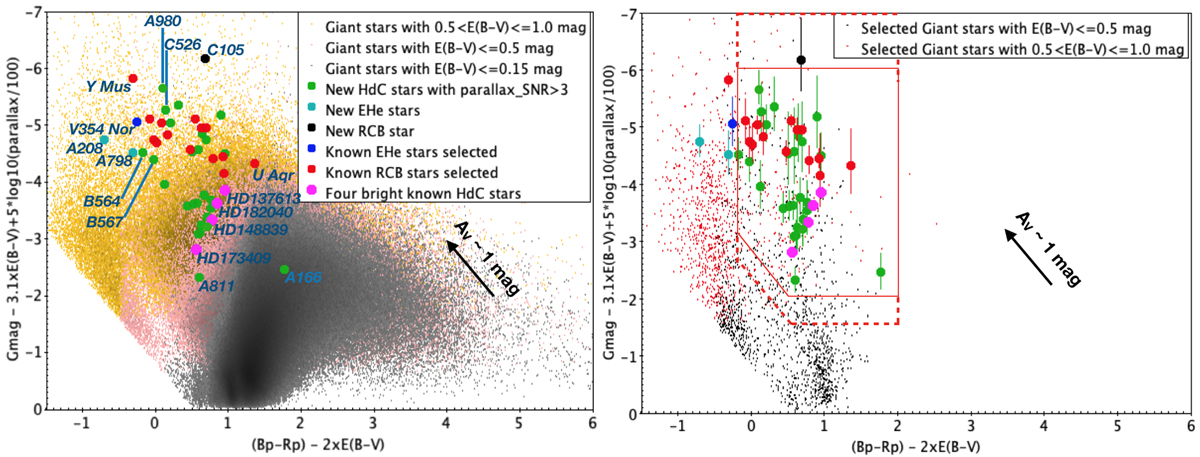
Fig. 2.
Download original image
HR diagram MG vs. (BP − RP) with Gaia magnitudes corrected for interstellar reddening. Left: distribution of all giant stars whose measured parallax S/N is higher than 5 (groups A and B), but that are impacted by a low level of interstellar reddening (E(B − V)≤0.15 mag, grey dots), a medium level (E(B − V)≤0.5 mag, pink dots), or an even higher level (0.5 < E(B − V)≤1.0 mag, orange dots). The positions of the known HdC and EHe stars that have passed the first selection cuts are indicated, as well as the newly discovered ones. Right: same as the left, except that the represented giant stars are those that have passed the first selection cuts. The black dots correspond to the objects impacted by a medium value of interstellar reddening, E(B − V)≤0.5 mag, while the red dots show those impacted by higher values up to 1.0 mag. The error bars on the y-axis due to the parallax measurement accuracy are shown only in the right diagram for clarity. The selection areas are marked with red lines: solid lines for groups A and B, and dashed lines for groups C and D, whose parallax is measured with an S/N lower than 5. The interstellar extinction of AV ∼ 1 mag is represented with a black arrow.
Current usage metrics show cumulative count of Article Views (full-text article views including HTML views, PDF and ePub downloads, according to the available data) and Abstracts Views on Vision4Press platform.
Data correspond to usage on the plateform after 2015. The current usage metrics is available 48-96 hours after online publication and is updated daily on week days.
Initial download of the metrics may take a while.