Fig. 7
Download original image
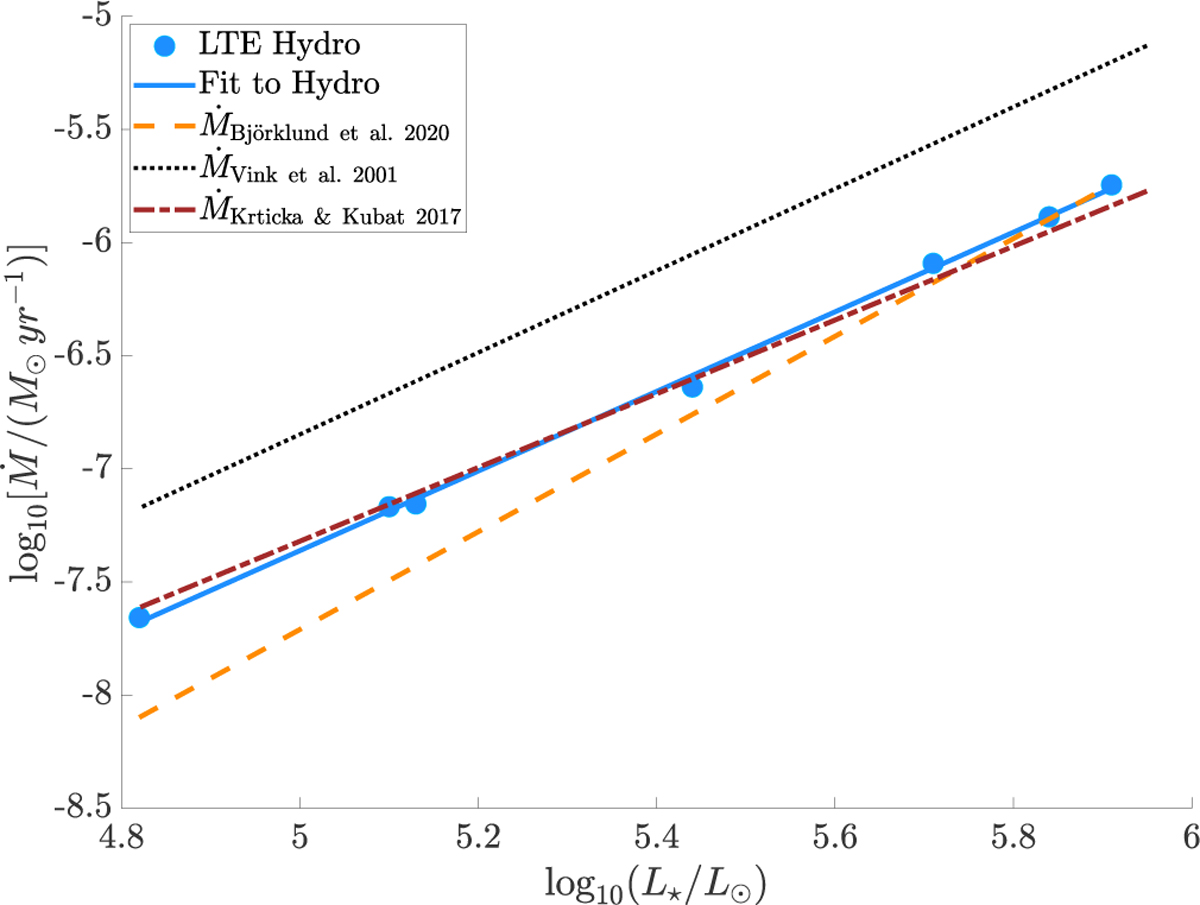
Comparison of the mass-los s rates from our grid of models (blue dots) to the mas s-los s values predicted in earlier works by Björklund et al. (2021), Krtička & Kubát (2017), and Vink et al. (2001). We plot the mass-loss-luminosity relations predicted by these authors with dashed orange, dotted-dashed maroon, and dotted black lines, respectively. We also over-plot the linear fit to our results (solid blue line).
Current usage metrics show cumulative count of Article Views (full-text article views including HTML views, PDF and ePub downloads, according to the available data) and Abstracts Views on Vision4Press platform.
Data correspond to usage on the plateform after 2015. The current usage metrics is available 48-96 hours after online publication and is updated daily on week days.
Initial download of the metrics may take a while.