Fig. 6
Download original image
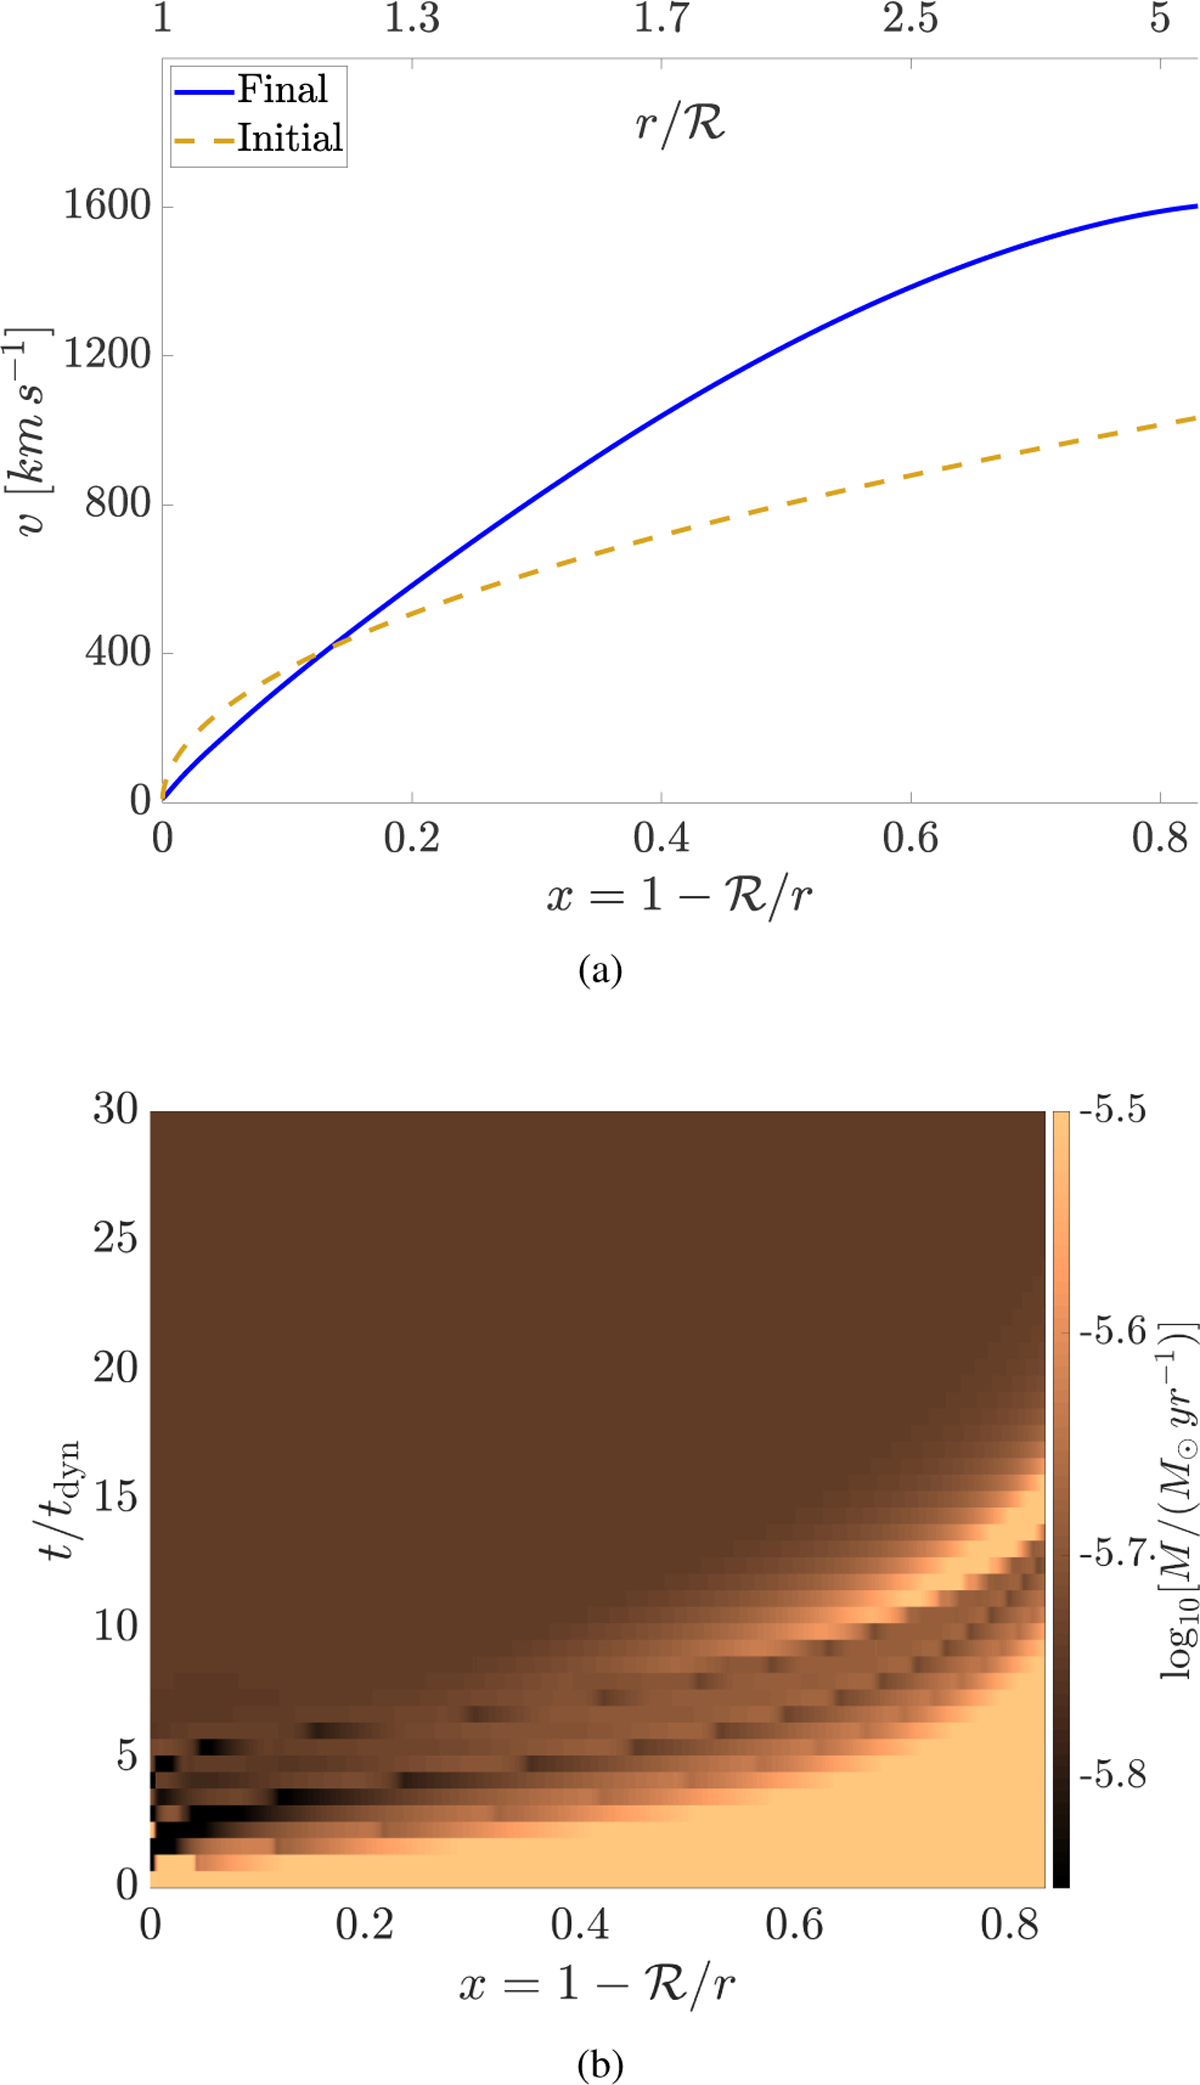
Comparison of the initial and final velocity profiles, and the radial and temporal variation of the mass-loss rate, (a) Radial velocity profiles of the initial conditions with the dashed orange line and the final snapshot with the solid blue line, (b) Colour map showing the relaxation or the radial profile of the logarithm of the mass-loss rate spanning the range from the initial conditions up to 30 tdyn.
Current usage metrics show cumulative count of Article Views (full-text article views including HTML views, PDF and ePub downloads, according to the available data) and Abstracts Views on Vision4Press platform.
Data correspond to usage on the plateform after 2015. The current usage metrics is available 48-96 hours after online publication and is updated daily on week days.
Initial download of the metrics may take a while.