Open Access
Fig. 3
Download original image
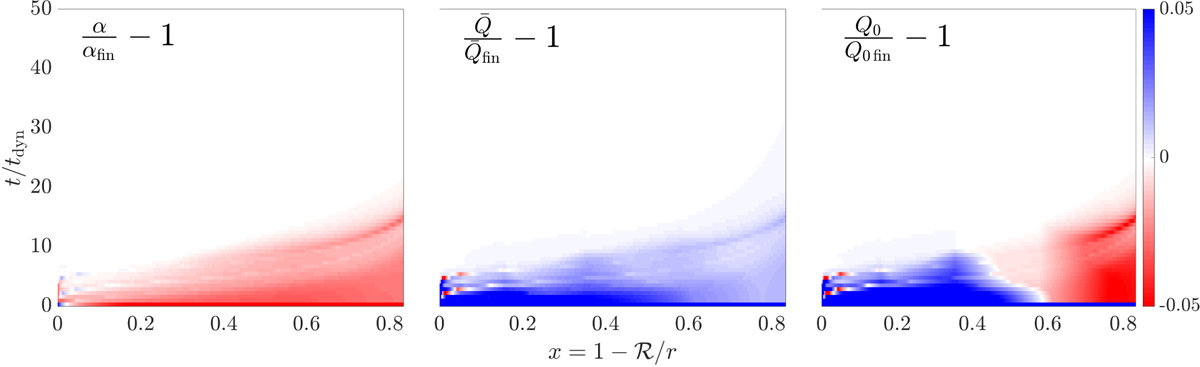
Colour map showing the radial and temporal variation in the line-distribution parameters. From the left to right we show α, ![]() , and Q0 radially normalised to their respective final profiles αfin,
, and Q0 radially normalised to their respective final profiles αfin, ![]() , and Q0 fin.
, and Q0 fin.
Current usage metrics show cumulative count of Article Views (full-text article views including HTML views, PDF and ePub downloads, according to the available data) and Abstracts Views on Vision4Press platform.
Data correspond to usage on the plateform after 2015. The current usage metrics is available 48-96 hours after online publication and is updated daily on week days.
Initial download of the metrics may take a while.