Fig. 1
Download original image
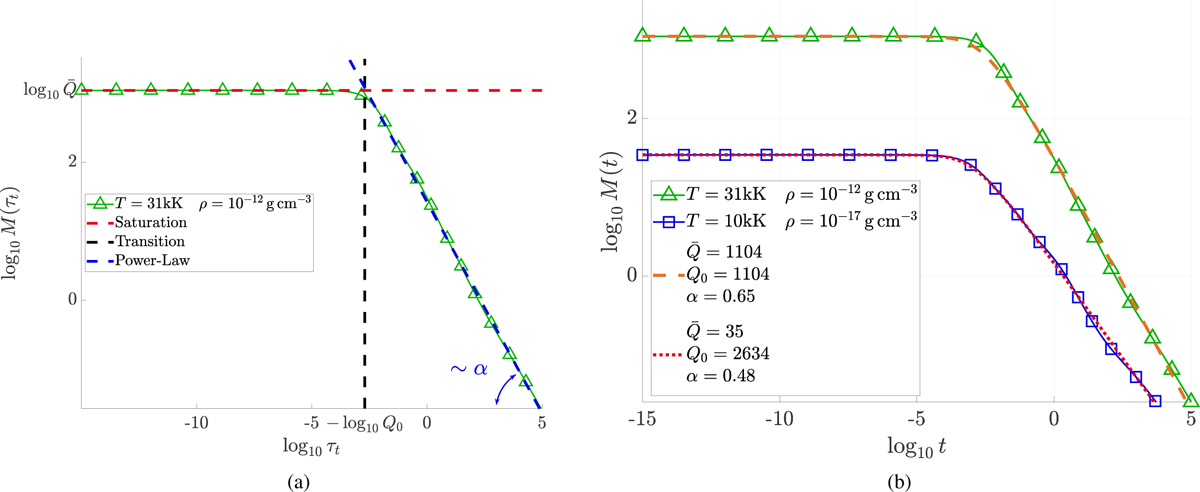
Force multiplier as computed by evaluating the numerical sum over the discrete set of spectral lines in the triangle-marked green curve. Panel a shows the saturation level indicated with the dashed red curve, a power-law region with the dashed blue line, and the locatton of a transition eotnl witt the dashed black line. Panel b shows the actual fit of two numerical results, where the triangle-marked green line has the same temperature and density as in (a) and the square-marked blue line assumes a different set of temperature and density. The derived fit parameters for each case are indicated in the corresponding legend.
Current usage metrics show cumulative count of Article Views (full-text article views including HTML views, PDF and ePub downloads, according to the available data) and Abstracts Views on Vision4Press platform.
Data correspond to usage on the plateform after 2015. The current usage metrics is available 48-96 hours after online publication and is updated daily on week days.
Initial download of the metrics may take a while.