Fig. A.6.
Download original image
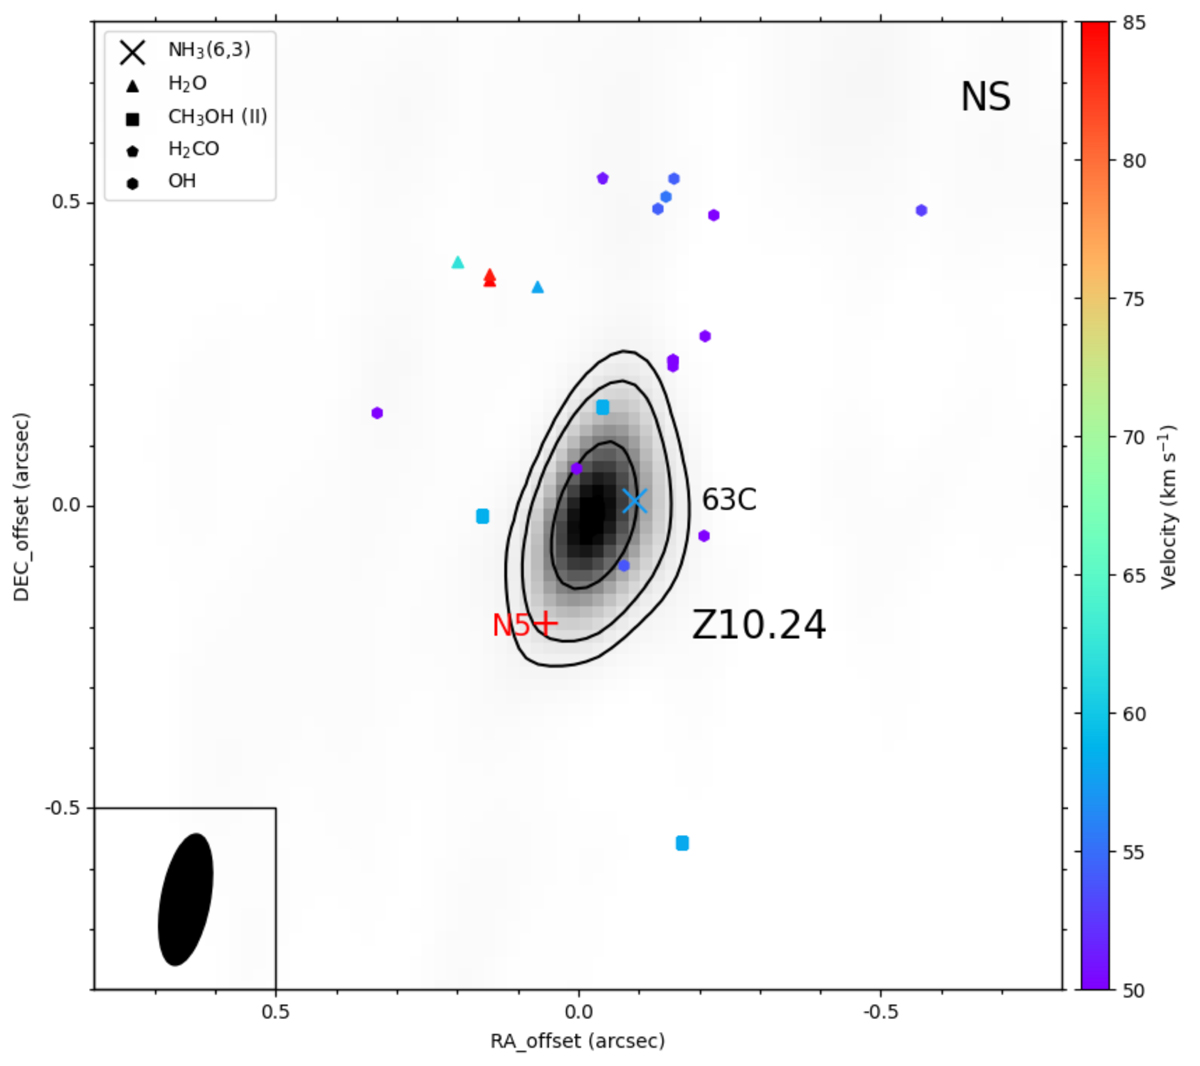
JVLA 1.6 cm continuum map of Sgr B2(NS) presented as gray shaded area and black contours with levels of 5, 10, 30, and 50 × 0.2 mJy beam−1. The reference position is αJ2000 = 17h47m20![]() 043, and δJ2000 = −28°22′41
043, and δJ2000 = −28°22′41![]() 143, the peak position of continuum source Z10.24. The yellow cross shows the position of NH3 (6,3) emission. H2O (McGrath et al. 2004), class II CH3OH (Caswell 1996; Hu et al. 2016; Lu et al. 2019), H2CO (Hoffman et al. 2007), and OH (Gaume & Claussen 1990) masers are presented as triangles, squares, pentagons, and hexagons, respectively. The color bar indicates the velocity range (VLSR) of the maser spots. The red cross marks the position of the hot core, Sgr B2(N5), taken from the 3 mm imaging line survey EMoCA (Bonfand et al. 2017). The systemic velocity of the hot core, N5, is VLSR = 60 km s−1 (Bonfand et al. 2017).
143, the peak position of continuum source Z10.24. The yellow cross shows the position of NH3 (6,3) emission. H2O (McGrath et al. 2004), class II CH3OH (Caswell 1996; Hu et al. 2016; Lu et al. 2019), H2CO (Hoffman et al. 2007), and OH (Gaume & Claussen 1990) masers are presented as triangles, squares, pentagons, and hexagons, respectively. The color bar indicates the velocity range (VLSR) of the maser spots. The red cross marks the position of the hot core, Sgr B2(N5), taken from the 3 mm imaging line survey EMoCA (Bonfand et al. 2017). The systemic velocity of the hot core, N5, is VLSR = 60 km s−1 (Bonfand et al. 2017).
Current usage metrics show cumulative count of Article Views (full-text article views including HTML views, PDF and ePub downloads, according to the available data) and Abstracts Views on Vision4Press platform.
Data correspond to usage on the plateform after 2015. The current usage metrics is available 48-96 hours after online publication and is updated daily on week days.
Initial download of the metrics may take a while.