Fig. 3.
Download original image
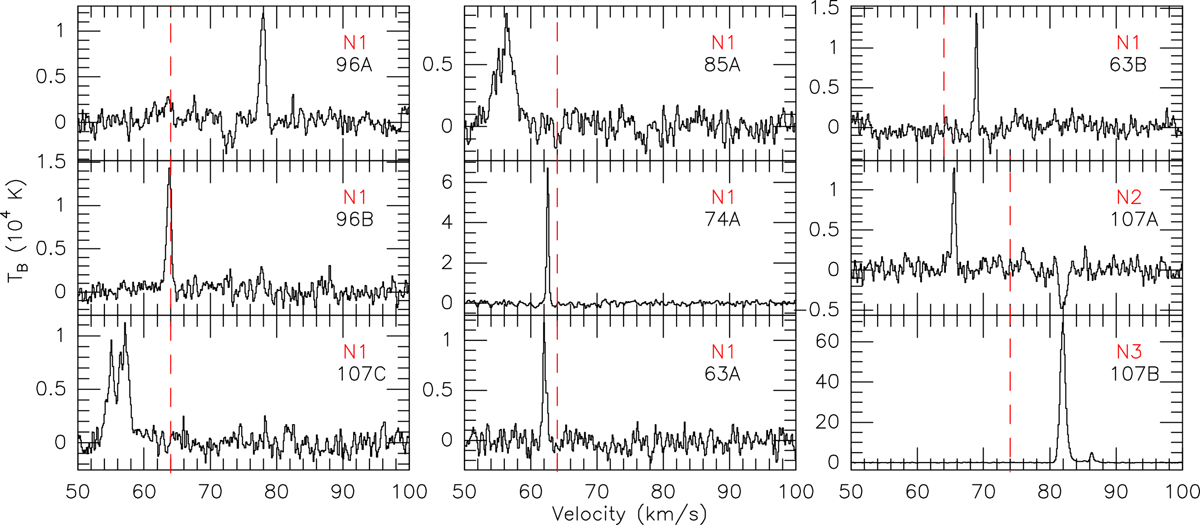
JVLA A-configuration spectra of NH3 transition lines toward Sgr B2(N). The dashed red lines indicate the systemic velocities of the associated hot cores. VLSR = 64 km s−1 for N1, and VLSR = 74 km s−1 for N2 and N3 (Bonfand et al. 2017). Main beam brightness temperature scales are presented on the left hand side of the profiles.
Current usage metrics show cumulative count of Article Views (full-text article views including HTML views, PDF and ePub downloads, according to the available data) and Abstracts Views on Vision4Press platform.
Data correspond to usage on the plateform after 2015. The current usage metrics is available 48-96 hours after online publication and is updated daily on week days.
Initial download of the metrics may take a while.