Fig. A.10.
Download original image
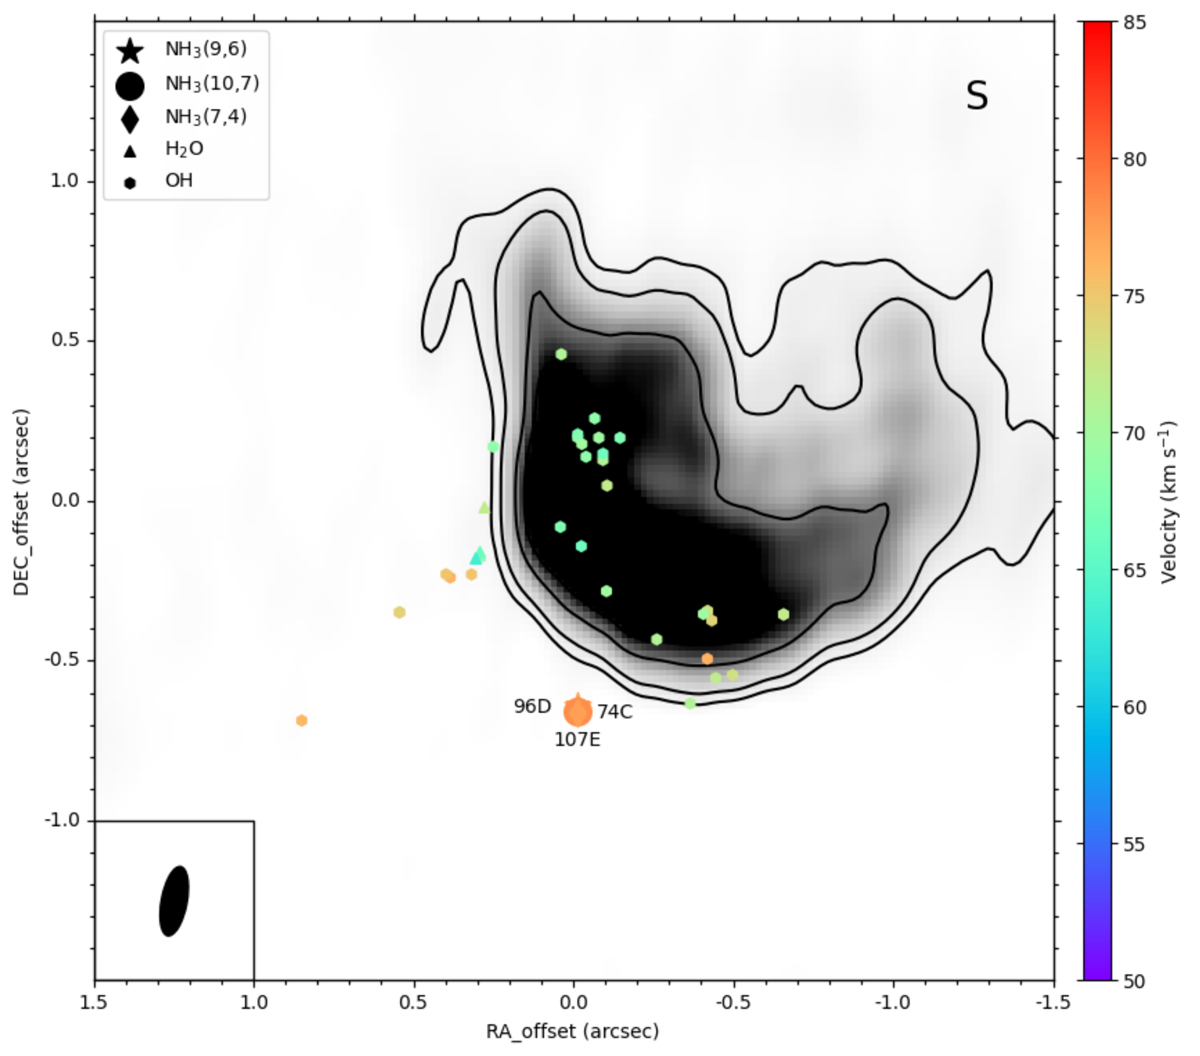
JVLA 1.6 cm continuum map of Sgr B2(S) presented as gray shaded areas and black contours with levels of 5, 10, 30, and 50 × 0.2 mJy beam−1. The reference position is αJ2000 = 17h47m20![]() 472, and δJ2000 = −28°23′45
472, and δJ2000 = −28°23′45![]() 120, the peak position of the continuum source. The thin diamond, star, and circle show the positions of NH3 (7,4), (9,6), and (10,7) emissions. H2O (McGrath et al. 2004) and OH (Gaume & Claussen 1990) masers are presented as triangles and hexagons, respectively. The color bar indicates the velocity range (VLSR) of the maser spots. The systemic velocity of Sgr B2(S) is VLSR = 60 km s−1 (Meng et al. 2022).
120, the peak position of the continuum source. The thin diamond, star, and circle show the positions of NH3 (7,4), (9,6), and (10,7) emissions. H2O (McGrath et al. 2004) and OH (Gaume & Claussen 1990) masers are presented as triangles and hexagons, respectively. The color bar indicates the velocity range (VLSR) of the maser spots. The systemic velocity of Sgr B2(S) is VLSR = 60 km s−1 (Meng et al. 2022).
Current usage metrics show cumulative count of Article Views (full-text article views including HTML views, PDF and ePub downloads, according to the available data) and Abstracts Views on Vision4Press platform.
Data correspond to usage on the plateform after 2015. The current usage metrics is available 48-96 hours after online publication and is updated daily on week days.
Initial download of the metrics may take a while.