Fig. 2.
Download original image
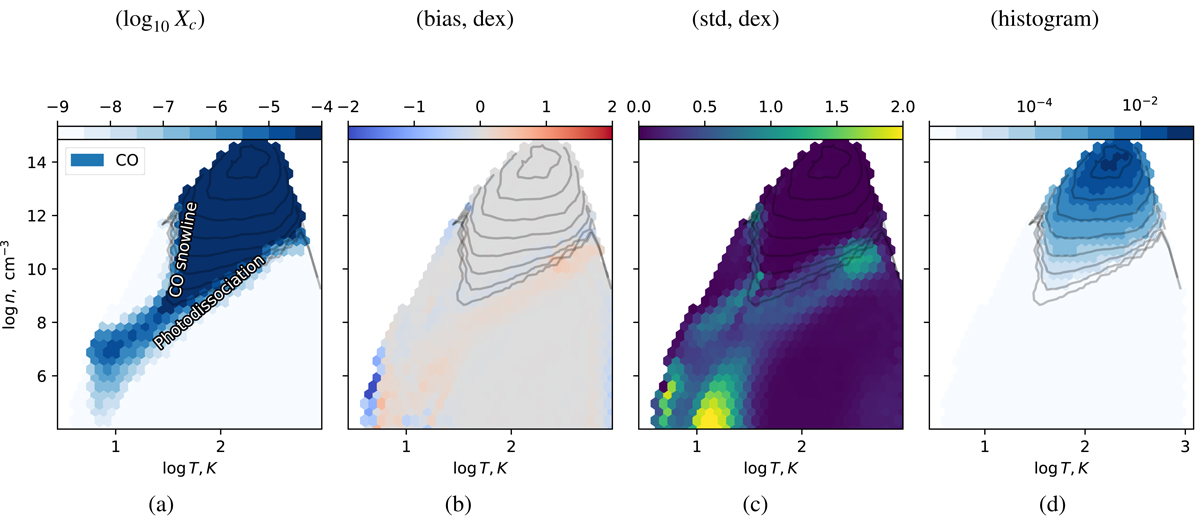
Performance of ML-accelerated chemistry predictions for CO. (a): mean log10 predicted relative abundance as a function of local temperature, gas density, and ionization rate. Darker areas correspond to larger relative (to H atoms) abundance. (b): median of the difference between the predicted values and test set data (bias, dex), in dex, as a function of temperature and density. Gray areas correspond to an unbiased fit. (c): the standard deviation between the predicted values and test set data, in dex (std, dex). (d): relative density (histogram) of species within the data points, with contours, which are also present on other panels. Various regions of the protoplanetary disk are described on panel (a). A detailed description of the processes leading to this figure is in the main text. Other molecules are shown in Fig. A.1.
Current usage metrics show cumulative count of Article Views (full-text article views including HTML views, PDF and ePub downloads, according to the available data) and Abstracts Views on Vision4Press platform.
Data correspond to usage on the plateform after 2015. The current usage metrics is available 48-96 hours after online publication and is updated daily on week days.
Initial download of the metrics may take a while.