Fig. 9
Download original image
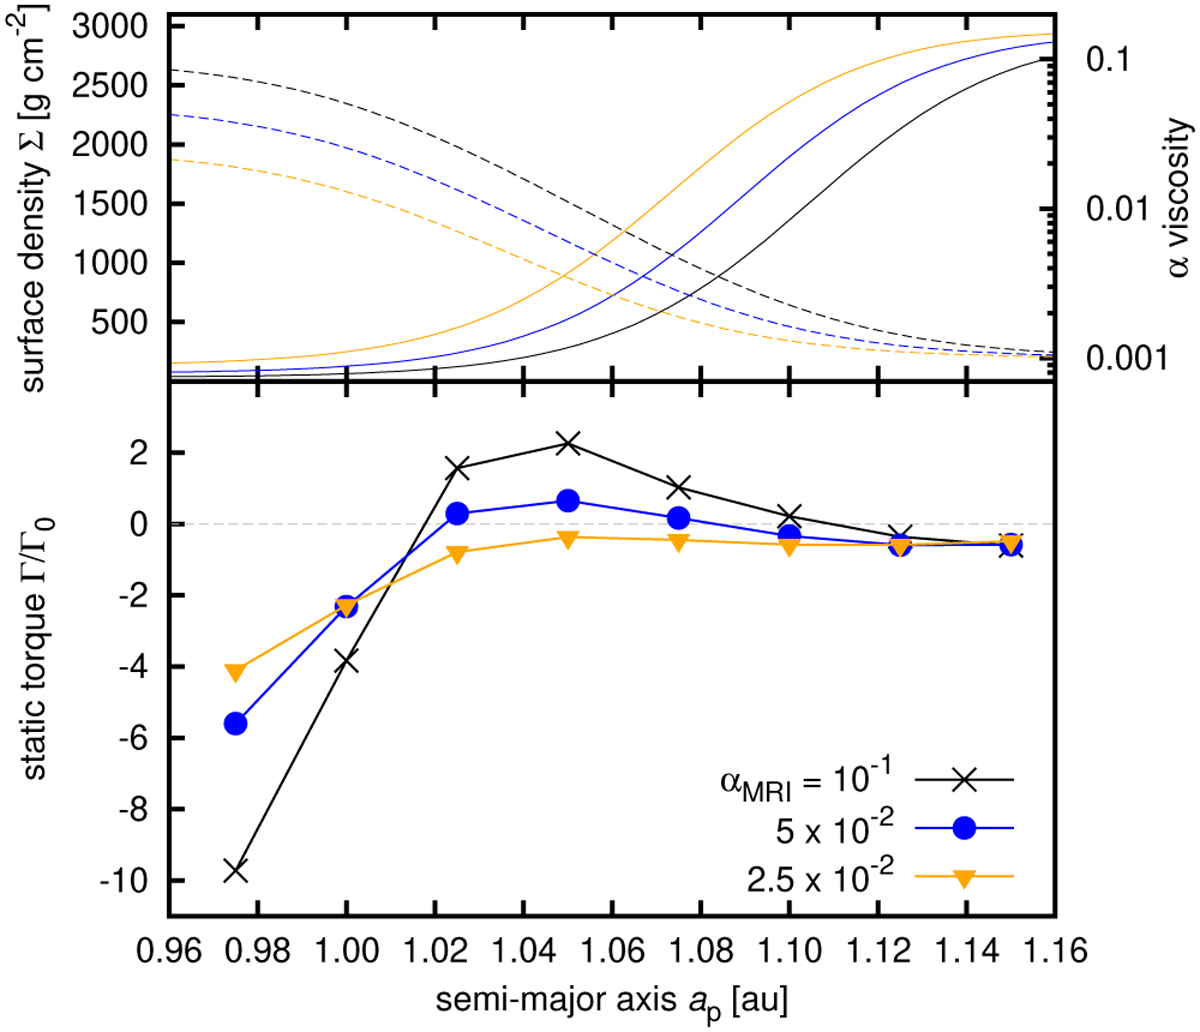
Locally isothermal simulations with a non-migrating planet. Top: Unperturbed surface density profile (solid lines, left vertical axis) across the viscosity transition (dashed lines, right vertical axis). Bottom: Measurements of the normalized static torque at various orbital radii (points) scanning the viscosity transition. In both panels, αDZ = 10−3 and different values of αMRI are distinguished by colours and symbols (see the plot legend).
Current usage metrics show cumulative count of Article Views (full-text article views including HTML views, PDF and ePub downloads, according to the available data) and Abstracts Views on Vision4Press platform.
Data correspond to usage on the plateform after 2015. The current usage metrics is available 48-96 hours after online publication and is updated daily on week days.
Initial download of the metrics may take a while.