Fig. 8
Download original image
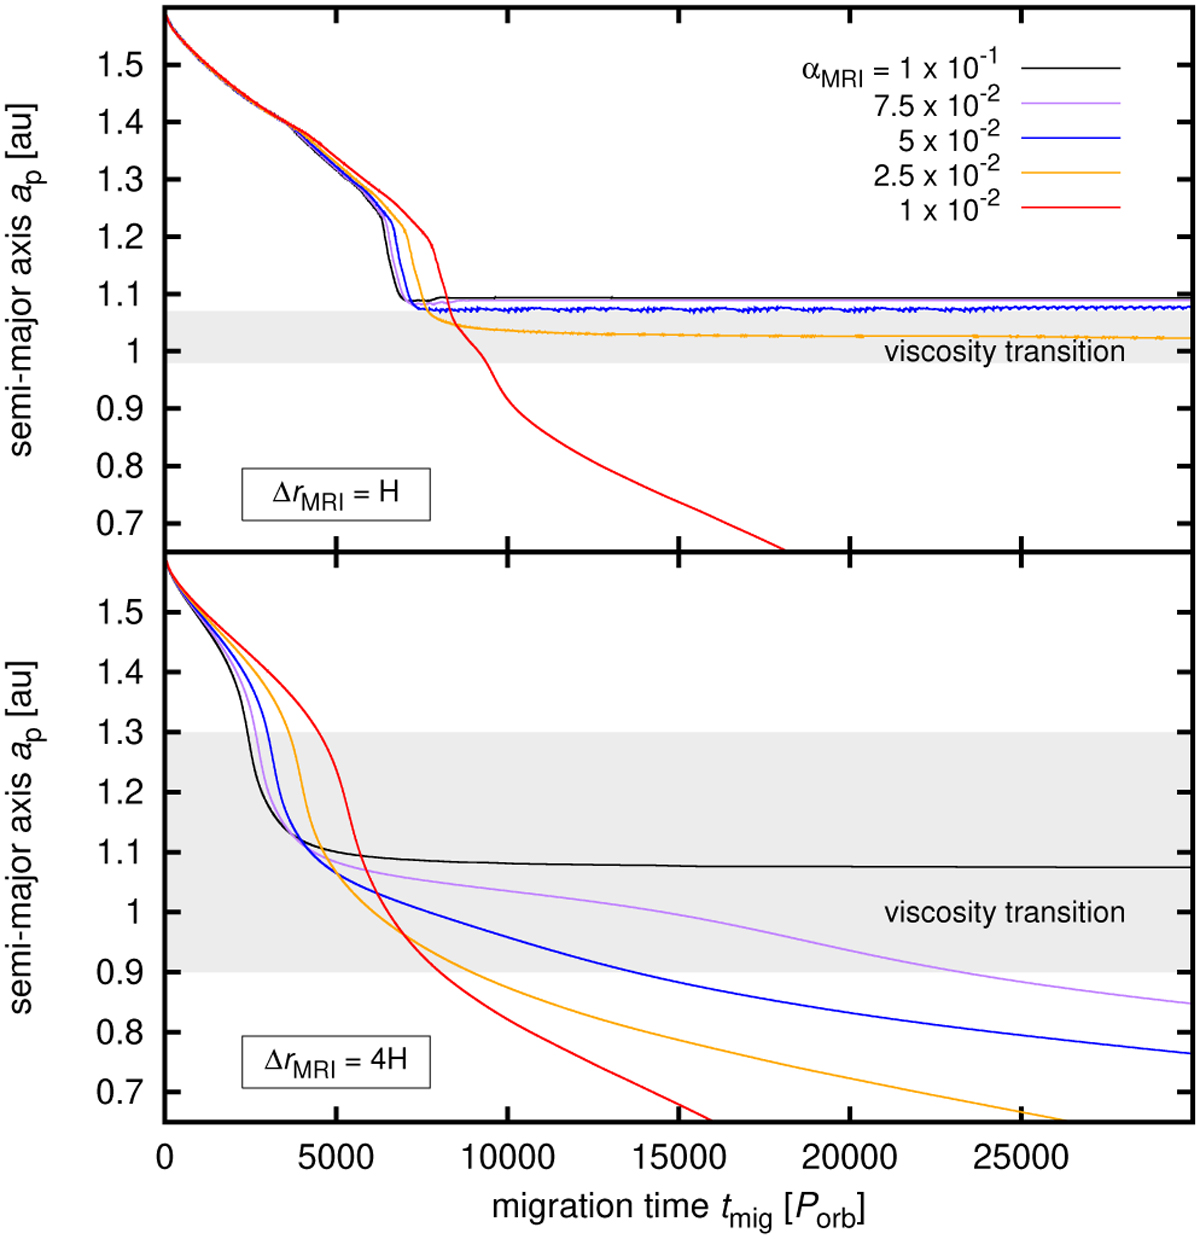
As in Fig. 1, but for fixed αDZ = 10−3 and different values of the viscosity transition width parameter ∆rMRI = H = 0.023 au (top) and ∆rMRI = 4H = 0.092 au (bottom). We point out that the total width of the viscosity transition (as marked by the shaded area) is not exactly equal to ∆rMRI; the influence of the parameter is described by Eq. (10).
Current usage metrics show cumulative count of Article Views (full-text article views including HTML views, PDF and ePub downloads, according to the available data) and Abstracts Views on Vision4Press platform.
Data correspond to usage on the plateform after 2015. The current usage metrics is available 48-96 hours after online publication and is updated daily on week days.
Initial download of the metrics may take a while.