Fig. 6
Download original image
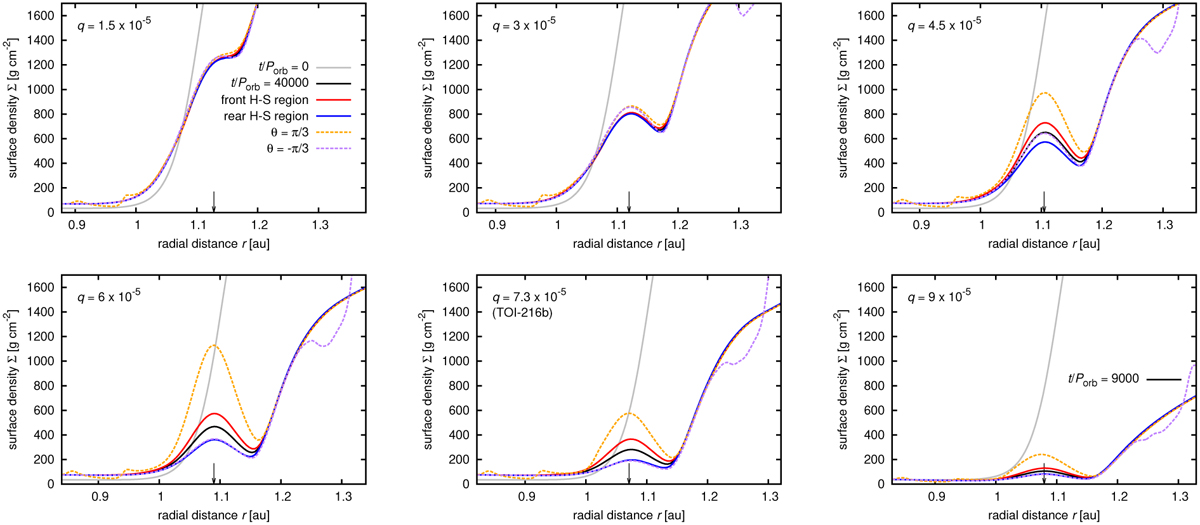
Radial surface density profiles for cases discussed in Fig. 5 (planet-to-star mass ratios q are given by labels in individual panels). We plot the initial azimuthal average (solid grey curve), the azimuthal average at torb = 40000 Porb for trapped planets and at torb = 9000 Porb for q = 9 × 10⁻⁵ (black solid curve), azimuthal averages taken over the span of the front (θ > 0) and rear (θ < 0) horseshoe regions (red and blue solid curves, respectively), and radial cuts Σ(r, θ = π/3) and Σ(r, θ = −π/3) (orange and purple dashed curves, respectively). We point out that the Hill sphere material is excluded from calculations of all azimuthal averages. The instantaneous position of the planet is marked by the black arrow. Unlike in Fig. 2, the vertical scale is linear. The spread of the curves (notably the orange and red ones) indicates the development of the front-rear asymmetry in the co-rotation region.
Current usage metrics show cumulative count of Article Views (full-text article views including HTML views, PDF and ePub downloads, according to the available data) and Abstracts Views on Vision4Press platform.
Data correspond to usage on the plateform after 2015. The current usage metrics is available 48-96 hours after online publication and is updated daily on week days.
Initial download of the metrics may take a while.