Fig. 4
Download original image
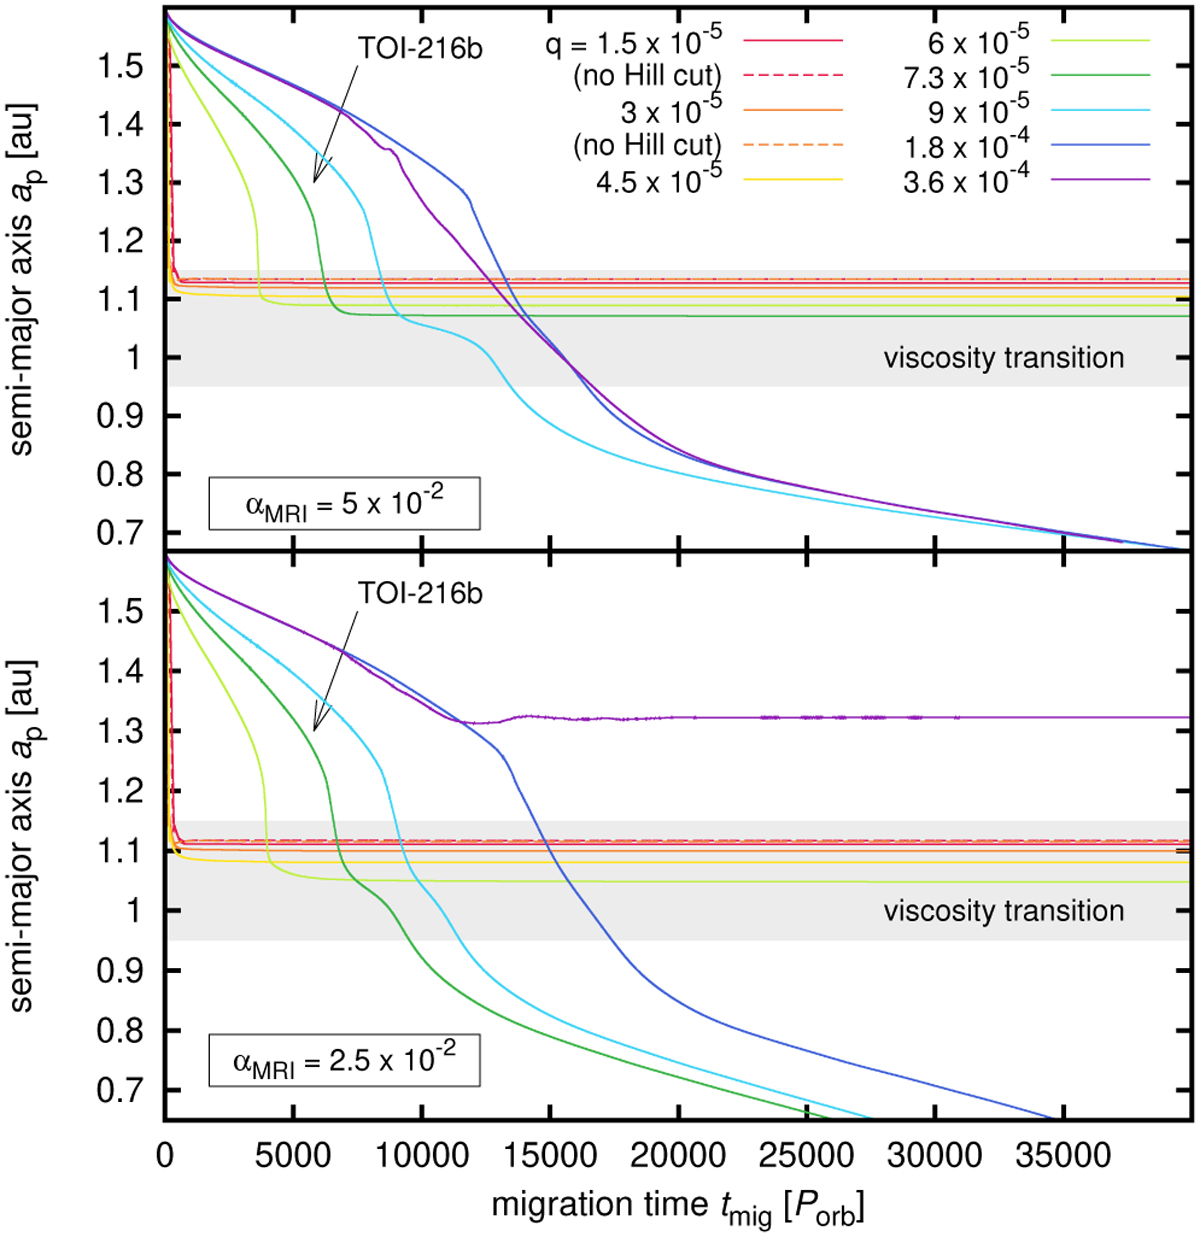
As in Fig. 1, but for fixed αDZ = 10−3 and different values of the planet-to-star mass ratio q (see the plot legend). Two cases of the MRI-active viscosity are considered, namely αMRI = 5 × 10⁻² (top) and 2.5 × 10⁻² (bottom). Dashed lines correspond to simulations in which the torque is evaluated from the whole disk, without any exclusion of the Hill sphere material. Solid lines are affected by the Hill cut (see Eq. (7)). For comparison purposes, the case of TOI-216b is labelled and marked with an arrow.
Current usage metrics show cumulative count of Article Views (full-text article views including HTML views, PDF and ePub downloads, according to the available data) and Abstracts Views on Vision4Press platform.
Data correspond to usage on the plateform after 2015. The current usage metrics is available 48-96 hours after online publication and is updated daily on week days.
Initial download of the metrics may take a while.