Fig. 3
Download original image
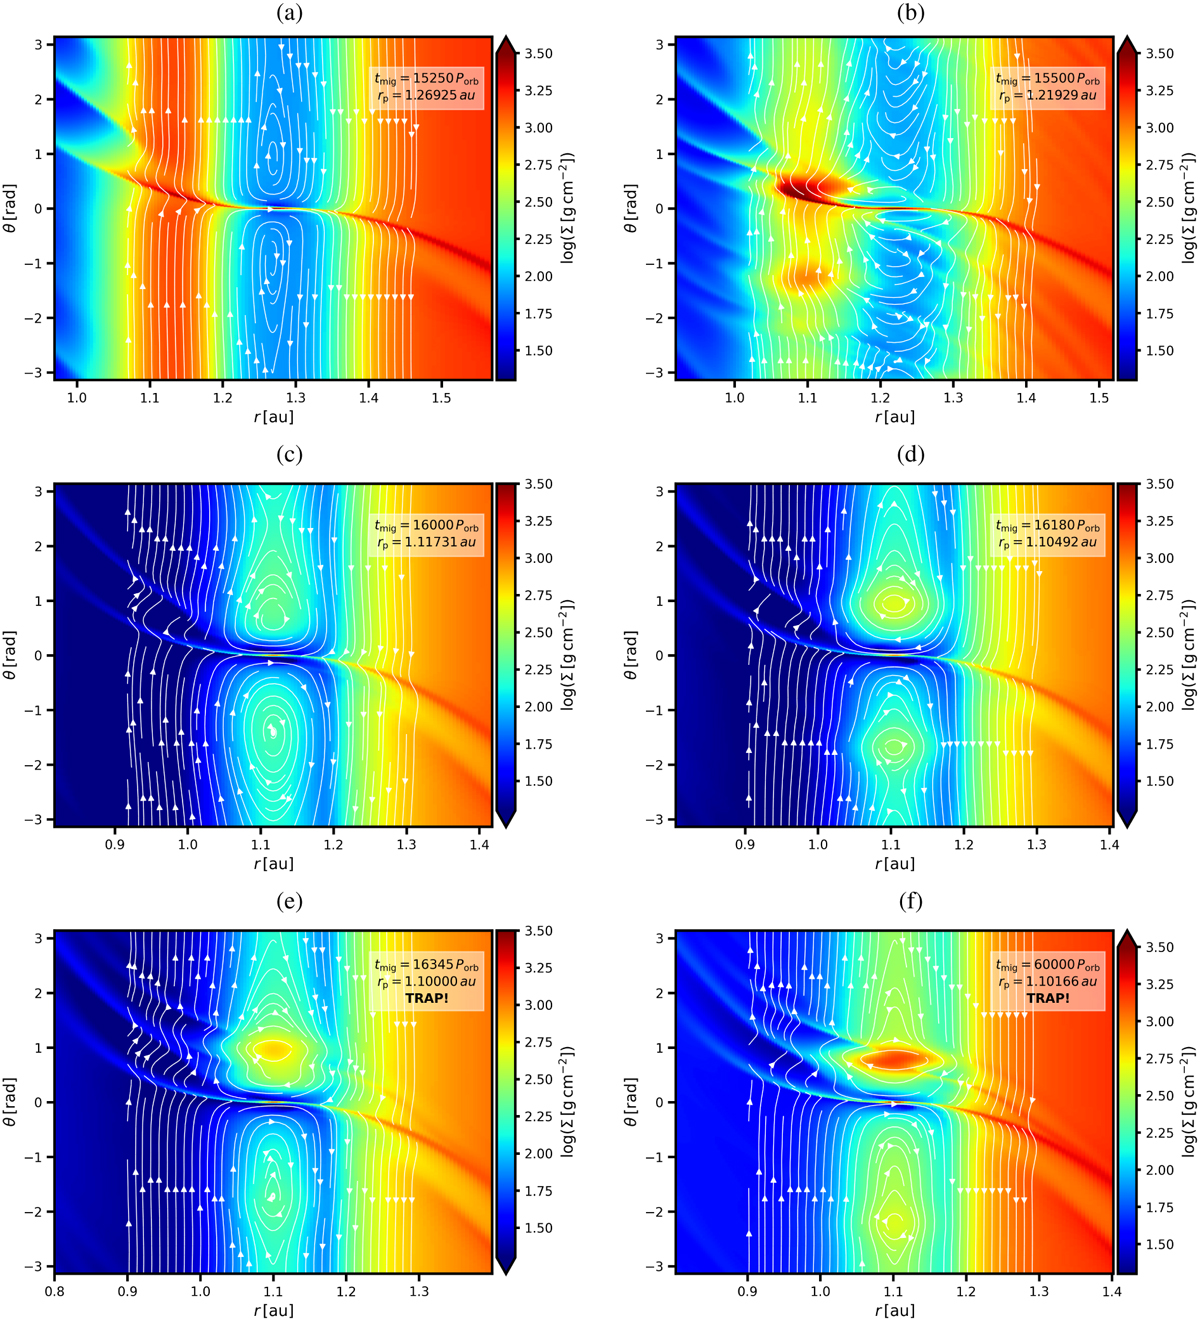
Temporal evolution of the gas surface density Σ (shown in a logarithmic colour gradient) in a simulation with αDZ = 10−3 and αMRI = 10−1. In each panel, the depicted portion of the disk is centred on TOI-216b. A rectangular projection of azimuthal coordinates is used to highlight disk features orbiting at the same radial separation. Streamlines of the gas flow are overlaid as white oriented curves. Individual panels are labelled with the migration time tmig (corresponding to Fig. 1) and the instantaneous orbital radius of the planet rp. Panels a–d capture important phases of migration of TOI-216b towards the viscosity transition, panel e shows a state shortly after the migration stalls and panel f shows the final state of our simulation. The figure is also available as an online movie showing the temporal evolution between tmig = 16 000 and 17 000 Porb.
Current usage metrics show cumulative count of Article Views (full-text article views including HTML views, PDF and ePub downloads, according to the available data) and Abstracts Views on Vision4Press platform.
Data correspond to usage on the plateform after 2015. The current usage metrics is available 48-96 hours after online publication and is updated daily on week days.
Initial download of the metrics may take a while.