Fig. 2
Download original image
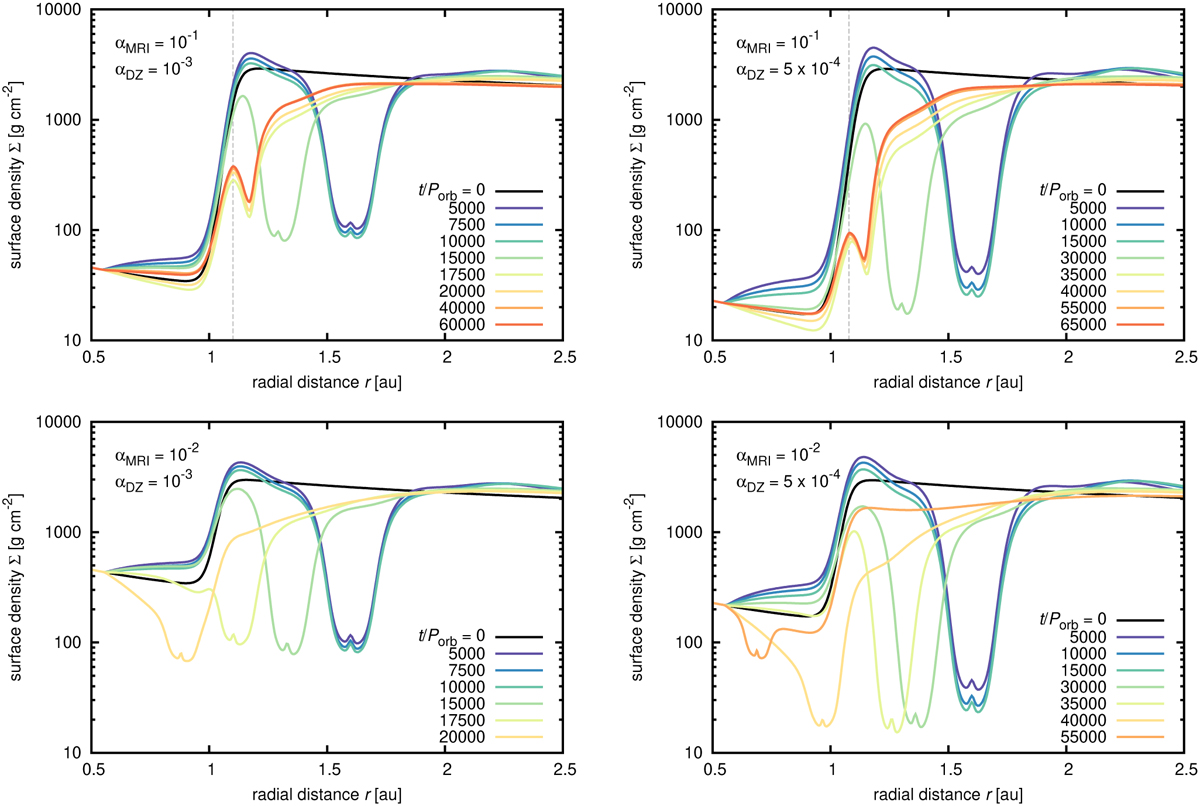
Evolution of the radial surface density profile for four limit-case viscosity transitions. Simulations shown here combine αDZ = 10−3 (left column) and 5 × 10⁻⁴ (right column) with αMRI = 10−1 (top row) and 10−2 (bottom row). The black curve corresponds to the unperturbed disk. Coloured curves correspond to different simulation times t as indicated by the plot legend. The planet is kept fixed for t = 104 and 1.5 × 10⁴ Porb when αDZ = 10−3 and 5 × 10⁻⁴, respectively. At larger times, the planet is allowed to migrate freely. The vertical dashed line marks the final location of the planet in simulations where trapping occurs. We point out that by setting Ṁ based on αDZ (see Sect. 3.1), the unperturbed density profile in the dead zone is identical in each simulation.
Current usage metrics show cumulative count of Article Views (full-text article views including HTML views, PDF and ePub downloads, according to the available data) and Abstracts Views on Vision4Press platform.
Data correspond to usage on the plateform after 2015. The current usage metrics is available 48-96 hours after online publication and is updated daily on week days.
Initial download of the metrics may take a while.