Fig. 14
Download original image
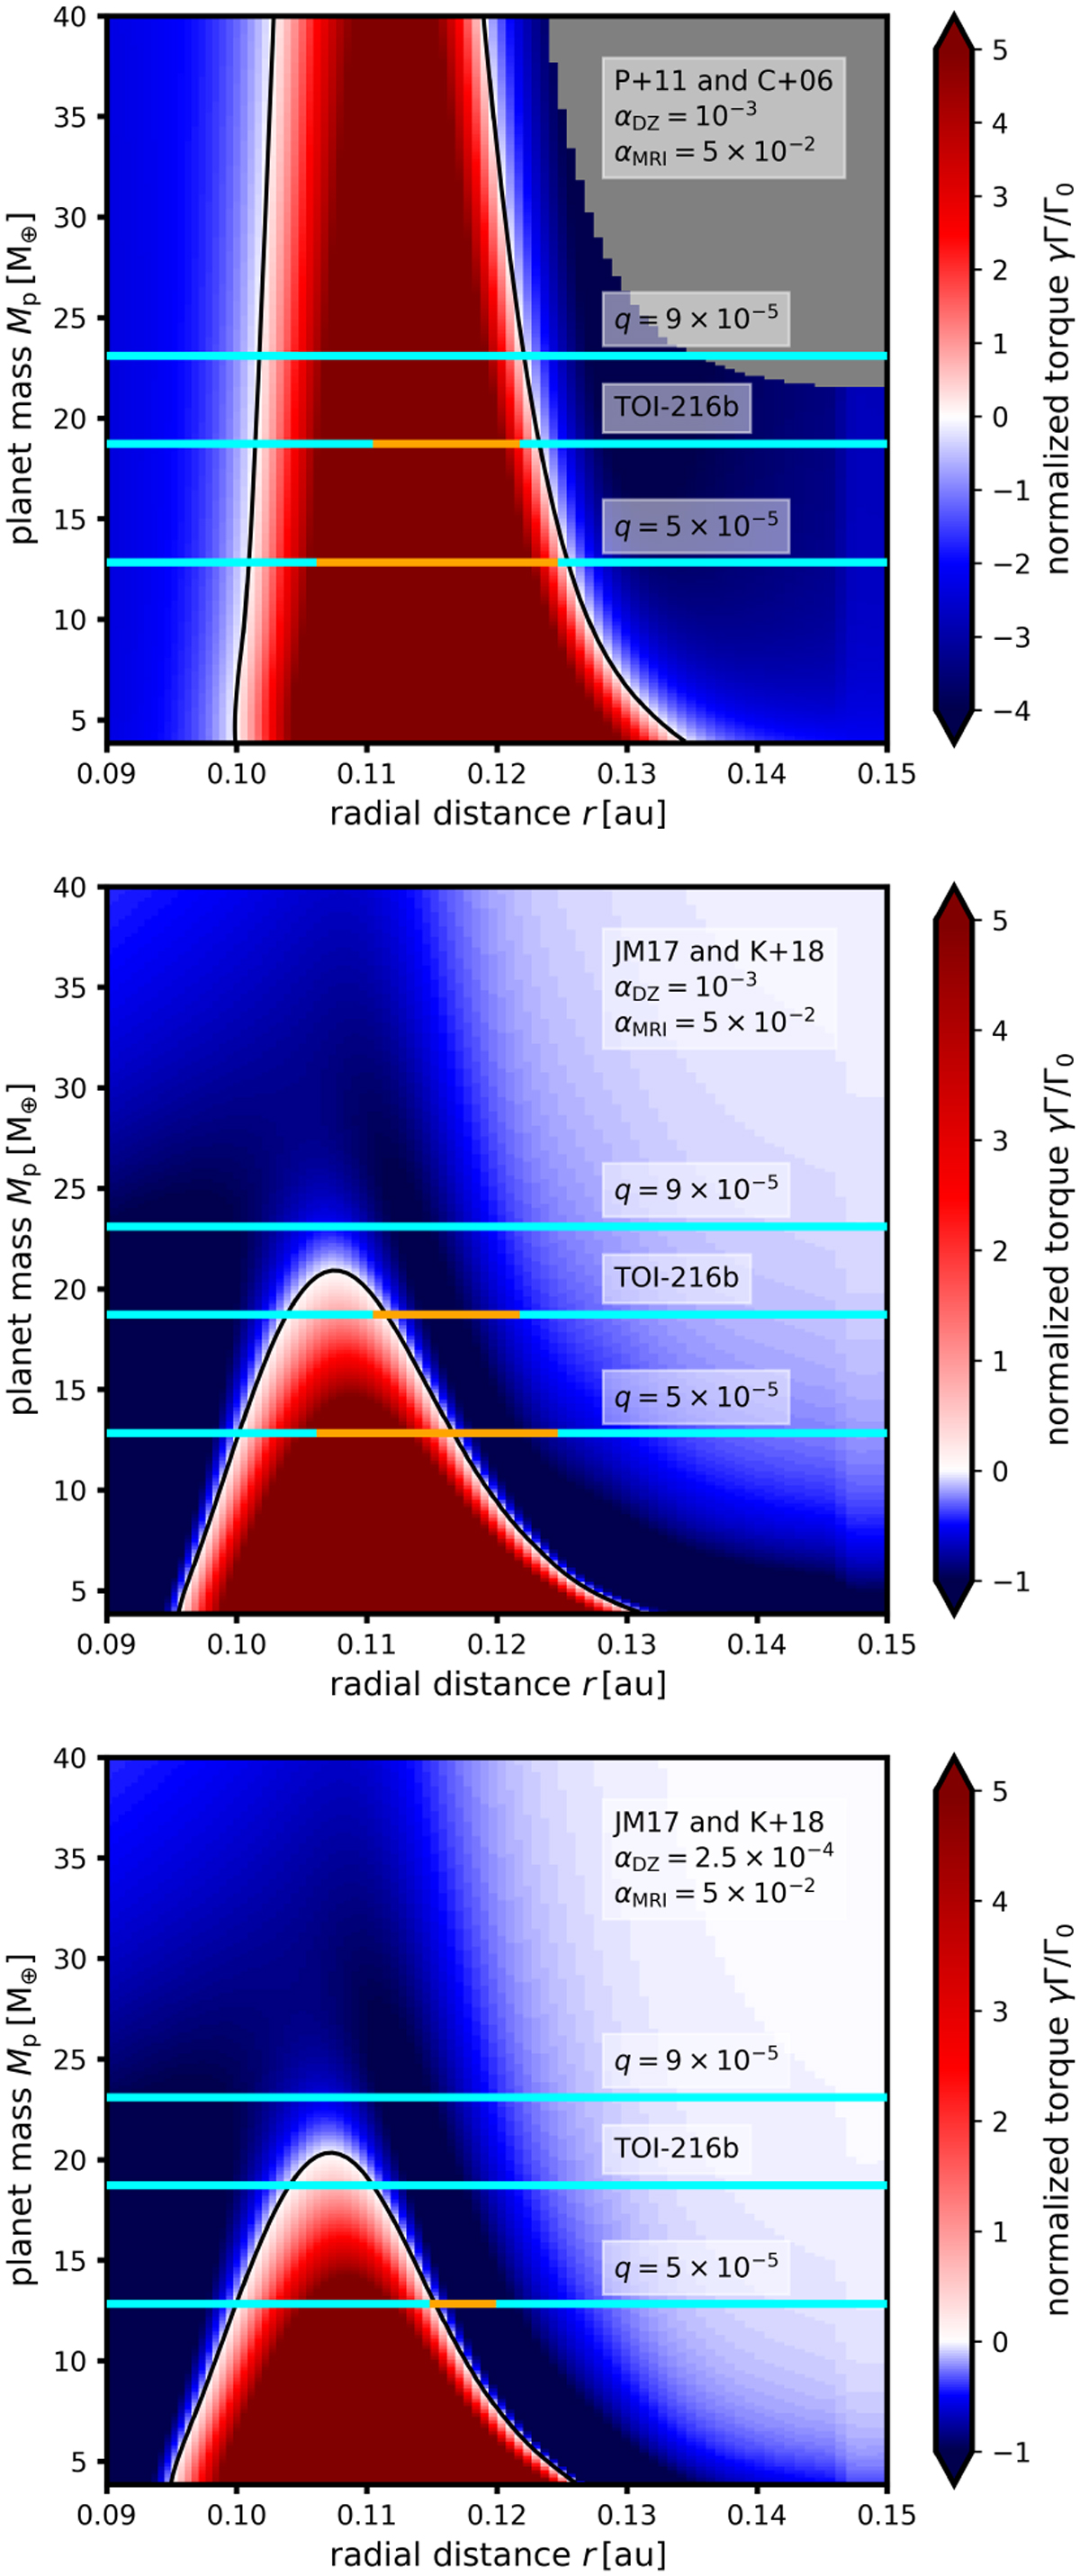
Qualitative comparison between our hydrodynamic simulations (horizontal lines) and torque formulae (colour gradient) that are often used in TV-body simulations of planet formation. Migration maps consisting of red and blue colour gradients mark the regions of the parametric space in which the torque formulae predict outward and inward migration, respectively. The black isocontour is where the predicted torque is exactly zero. Orange and cyan lines mark the extent of semi- major axes for which our simulations resulted in positive and negative torques, respectively (see Fig. 12). In the top panel, γΓ/Γ0 is calculated following Paardekooper et al. (2011) for all planetary masses that do not violate the gap-opening criterion of Crida et al. (2006) (planets that do violate Crida's criterion belong to the grey region). In middle and bottom panels, the torque is calculated according to Jiménez & Mas- set (2017) and blended between Type I and Type II regimes using the recipe of Kanagawa et al. (2018). Top and middle panels are based on the unperturbed radial profiles of our non-isothermal disk with the viscosity transition αDZ = 10−3 and αMRI = 5 × 10⁻² (see Fig. 11); viscosities in the bottom panel are αDZ = 2.5 × 10⁻⁴ and αMRI = 5 × 10⁻². We recall that the planet mass Mp is obtained from q assuming the stellar mass of TOI-216, M* = 0.77 M⊙.
Current usage metrics show cumulative count of Article Views (full-text article views including HTML views, PDF and ePub downloads, according to the available data) and Abstracts Views on Vision4Press platform.
Data correspond to usage on the plateform after 2015. The current usage metrics is available 48-96 hours after online publication and is updated daily on week days.
Initial download of the metrics may take a while.