Fig. 13
Download original image
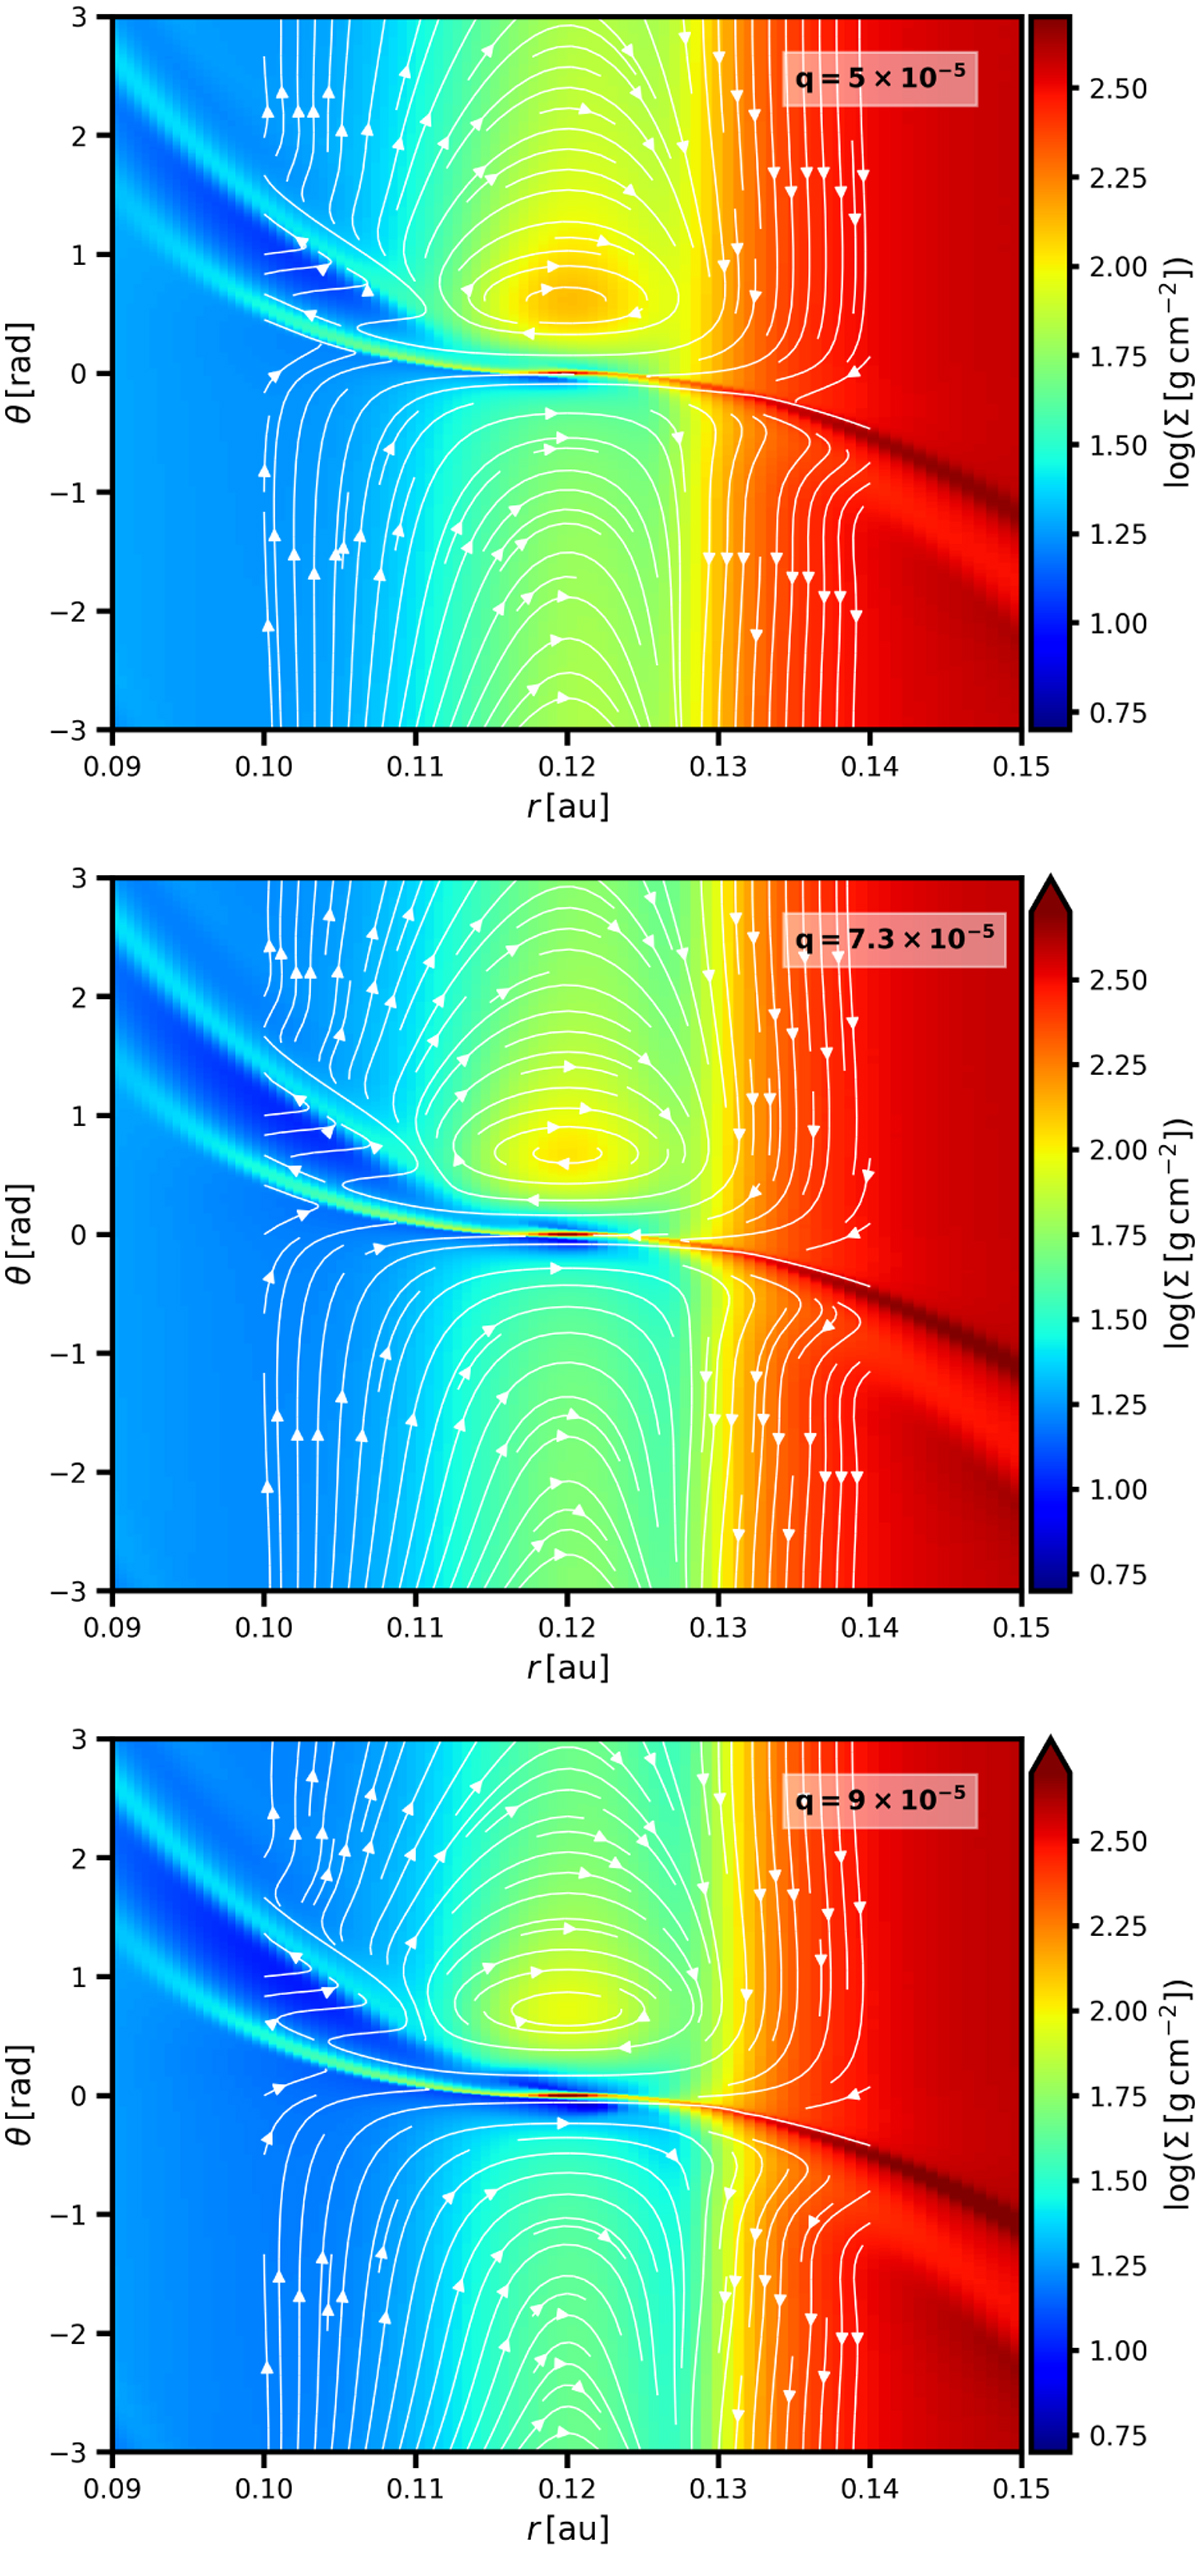
Logarithm of the gas surface density in non-isothermal simulations with αDZ = 10−3 and αMRI = 5 × 10⁻². The panels correspond to different planet-to-star mass ratios as marked by the labels. Each planet is held in a fixed circular orbit with ap = 0.12au. We overplot streamlines of the gas flow relative to the planet with white curves. The figure is also available as an online movie that scans all values of ap for which the static torque was measured. Corresponding torque measurements can be found in the top row of Fig. 12 (blue data points).
Current usage metrics show cumulative count of Article Views (full-text article views including HTML views, PDF and ePub downloads, according to the available data) and Abstracts Views on Vision4Press platform.
Data correspond to usage on the plateform after 2015. The current usage metrics is available 48-96 hours after online publication and is updated daily on week days.
Initial download of the metrics may take a while.