Fig. 12
Download original image
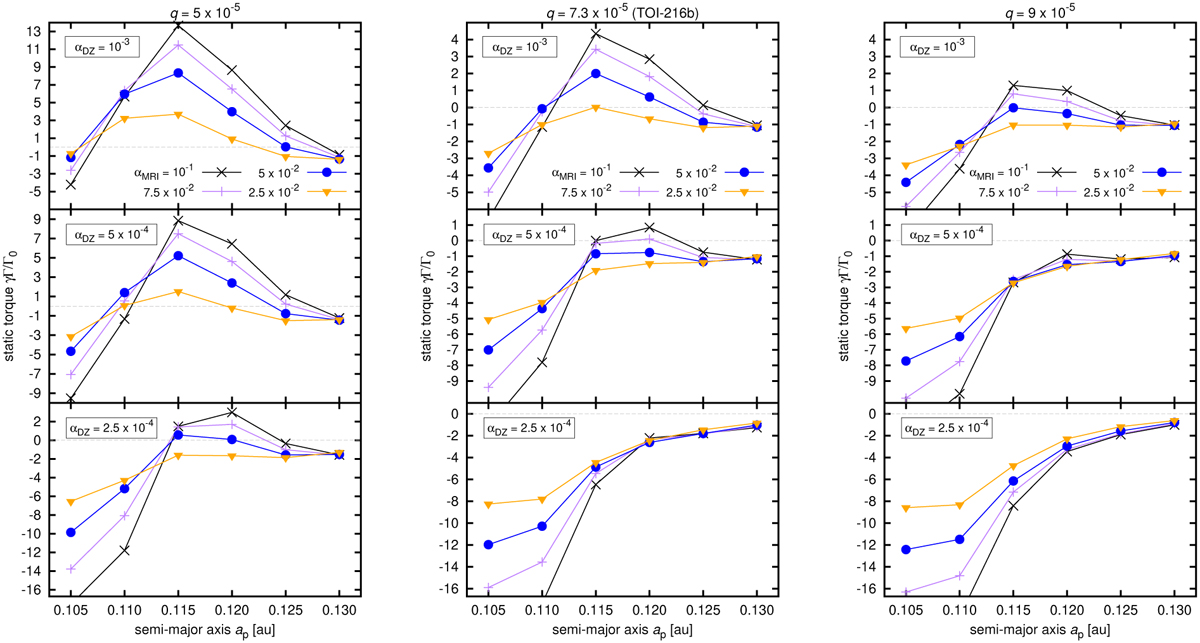
Normalized static torque γΓ/Γ0 measured in our non-isothermal simulations as a function of the planetary orbital distance ap. We show measurements for q = 5 × 10⁻⁵ (left column), 7.3 × 10⁻⁵ (TOI-216b; middle column) and 9 × 10⁻⁵ (right column). Individual rows correspond to different viscosities aDZ in the dead zone (see the boxed labels) and colour-coded points with line segments correspond to different viscosities αMRI in the MRI-active zone (see the plot legend). The horizontal dashed line is where the total torque is zero. We point out that the extent of the vertical axis in the left column differs from the middle and right columns.
Current usage metrics show cumulative count of Article Views (full-text article views including HTML views, PDF and ePub downloads, according to the available data) and Abstracts Views on Vision4Press platform.
Data correspond to usage on the plateform after 2015. The current usage metrics is available 48-96 hours after online publication and is updated daily on week days.
Initial download of the metrics may take a while.