Fig. 11
Download original image
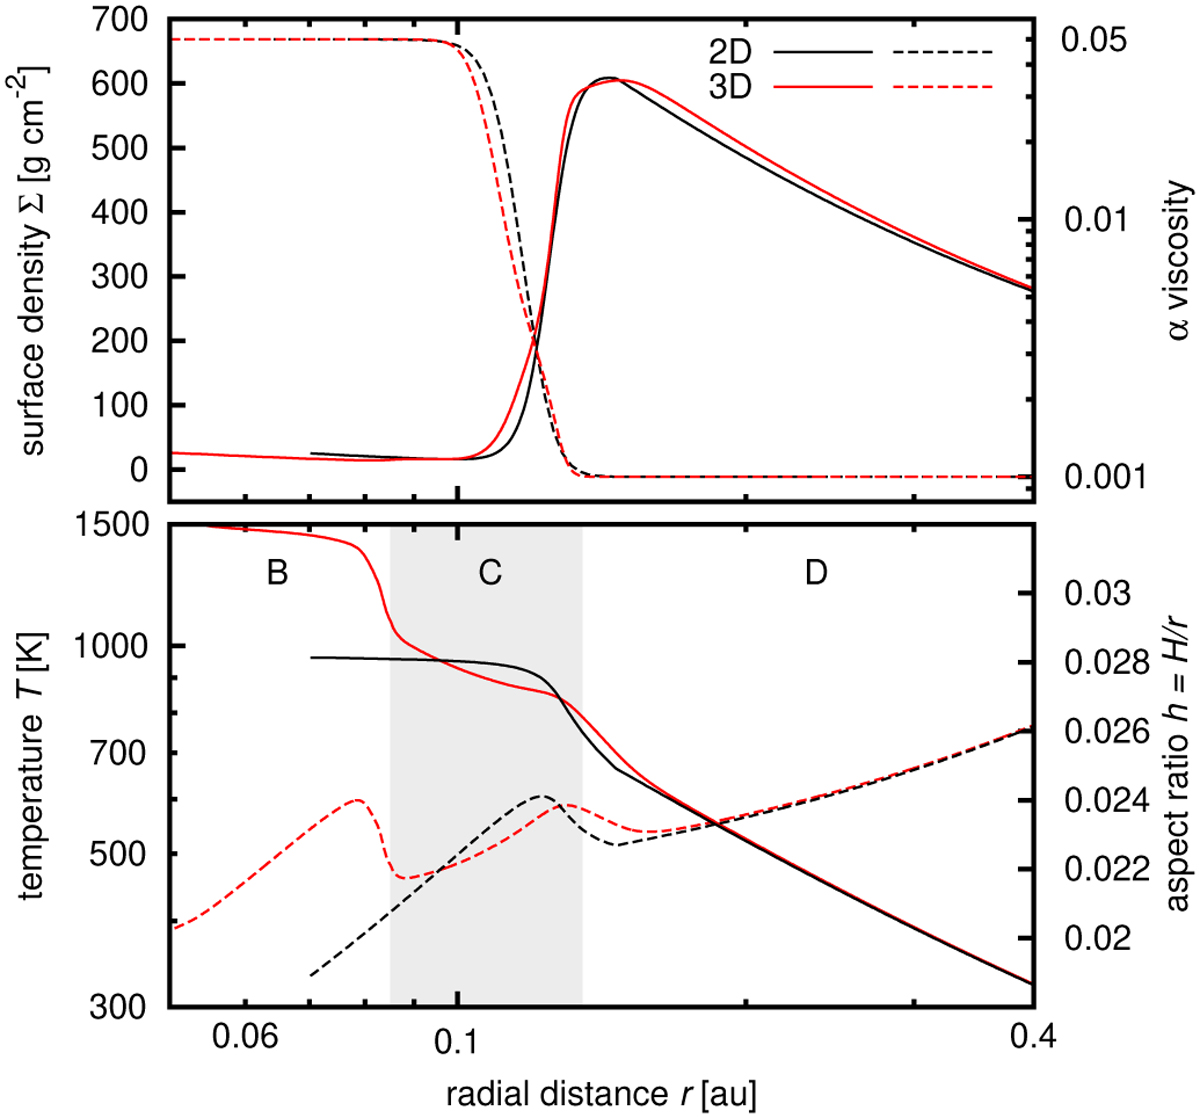
Radial profiles of the surface density Σ (top, left vertical axis, solid curves), α viscosity (top, right vertical axis, dashed curves), temperature T (bottom, left vertical axis, solid curves) and aspect ratio h (bottom, right vertical axis, dashed curves). A comparison is shown between our 2D non-isothermal model (black curves) and a 3D vertically resolved radiative hydrostatic model (red curves). The bottom panel is split into three regions discussed in Sect. 2.2, namely the dust halo (B), the condensation front (C) and the flared disk (D) (e.g. Ueda et al. 2017).
Current usage metrics show cumulative count of Article Views (full-text article views including HTML views, PDF and ePub downloads, according to the available data) and Abstracts Views on Vision4Press platform.
Data correspond to usage on the plateform after 2015. The current usage metrics is available 48-96 hours after online publication and is updated daily on week days.
Initial download of the metrics may take a while.