Fig. 1
Download original image
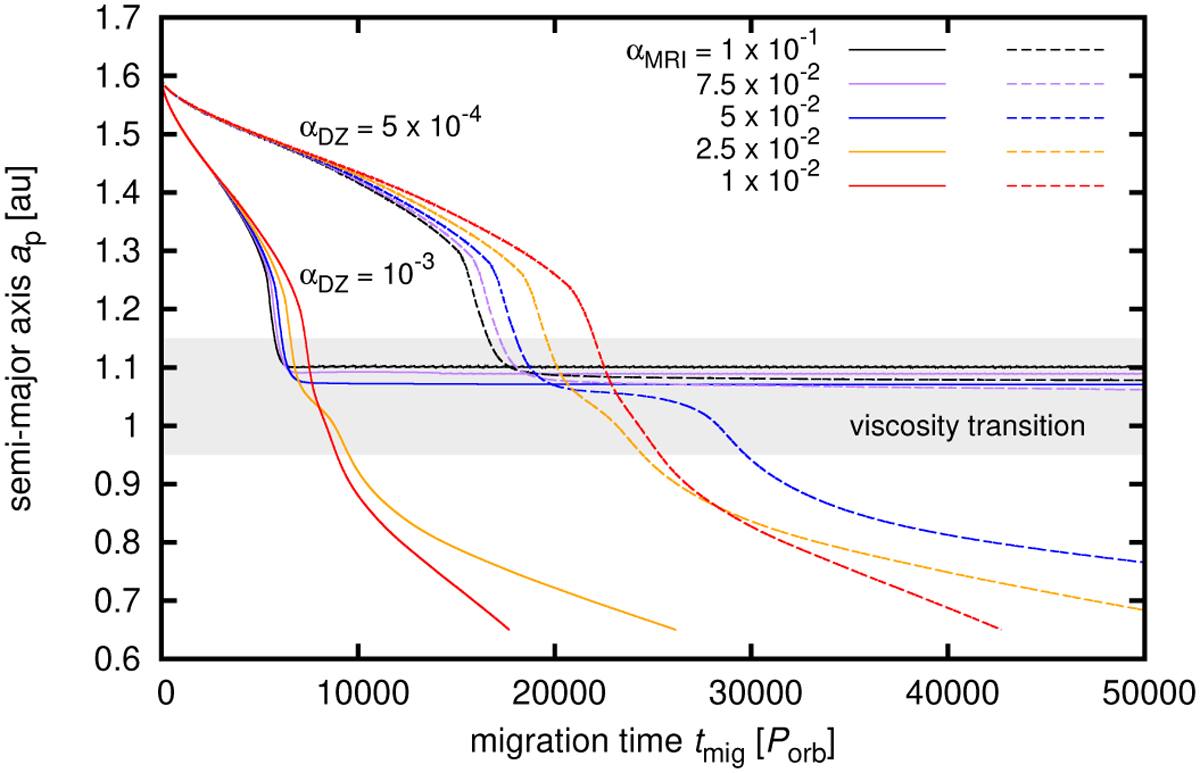
Temporal evolution of the semi-major axis ap of migrating TOI- 216b. Horizontal axis measures the migration time tmig (we do not show the simulation stages during which the planet was non-migrating). Solid lines are for αDZ = 10−3 and dashed lines are for αDZ = 5 × 10⁻⁴. Different values of αMRI are distinguished by colour and specified in the plot legend. The shaded area marks the disk region over which αDZ increases to αMRI. Outwards from the shaded area, there is the dead zone. The MRI-active zone is located inwards from the shaded area.
Current usage metrics show cumulative count of Article Views (full-text article views including HTML views, PDF and ePub downloads, according to the available data) and Abstracts Views on Vision4Press platform.
Data correspond to usage on the plateform after 2015. The current usage metrics is available 48-96 hours after online publication and is updated daily on week days.
Initial download of the metrics may take a while.