Fig. 7
Download original image
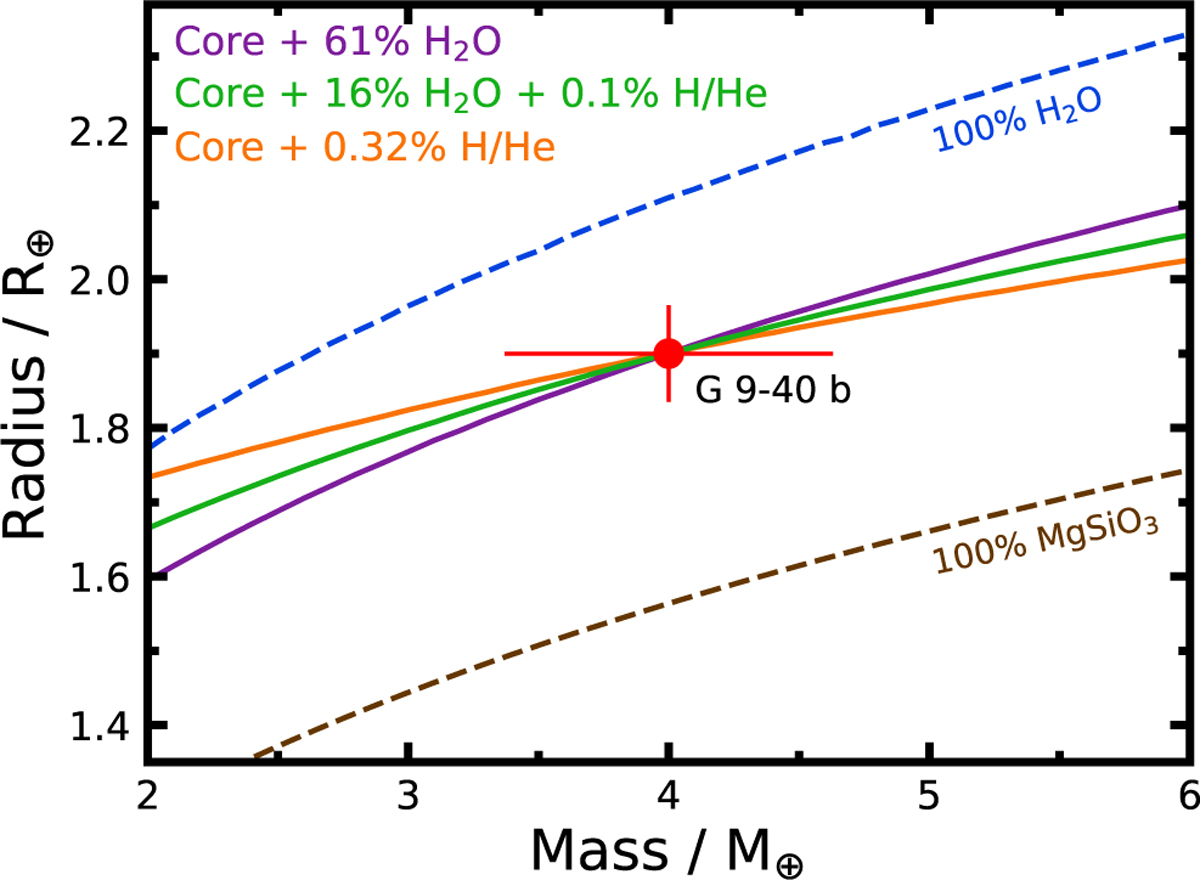
Mass-radius diagram centered on G 9–40 b. The solid purple, orange and green curves show a selection of best-fitting compositions for the planet, assuming an Earth-like structure (1/3 iron, 2/3 silicates), a surface temperature equal to the planetary equilibrium temperature (440.6 K), and a surface pressure of 1 bar. The dashed blue and brown lines represent theoretical pure H2O and pure silicate planets, at the same surface temperature, respectively. Temperature-dependent mass-radius curves were generated using the model of Nixon & Madhusudhan (2021).
Current usage metrics show cumulative count of Article Views (full-text article views including HTML views, PDF and ePub downloads, according to the available data) and Abstracts Views on Vision4Press platform.
Data correspond to usage on the plateform after 2015. The current usage metrics is available 48-96 hours after online publication and is updated daily on week days.
Initial download of the metrics may take a while.