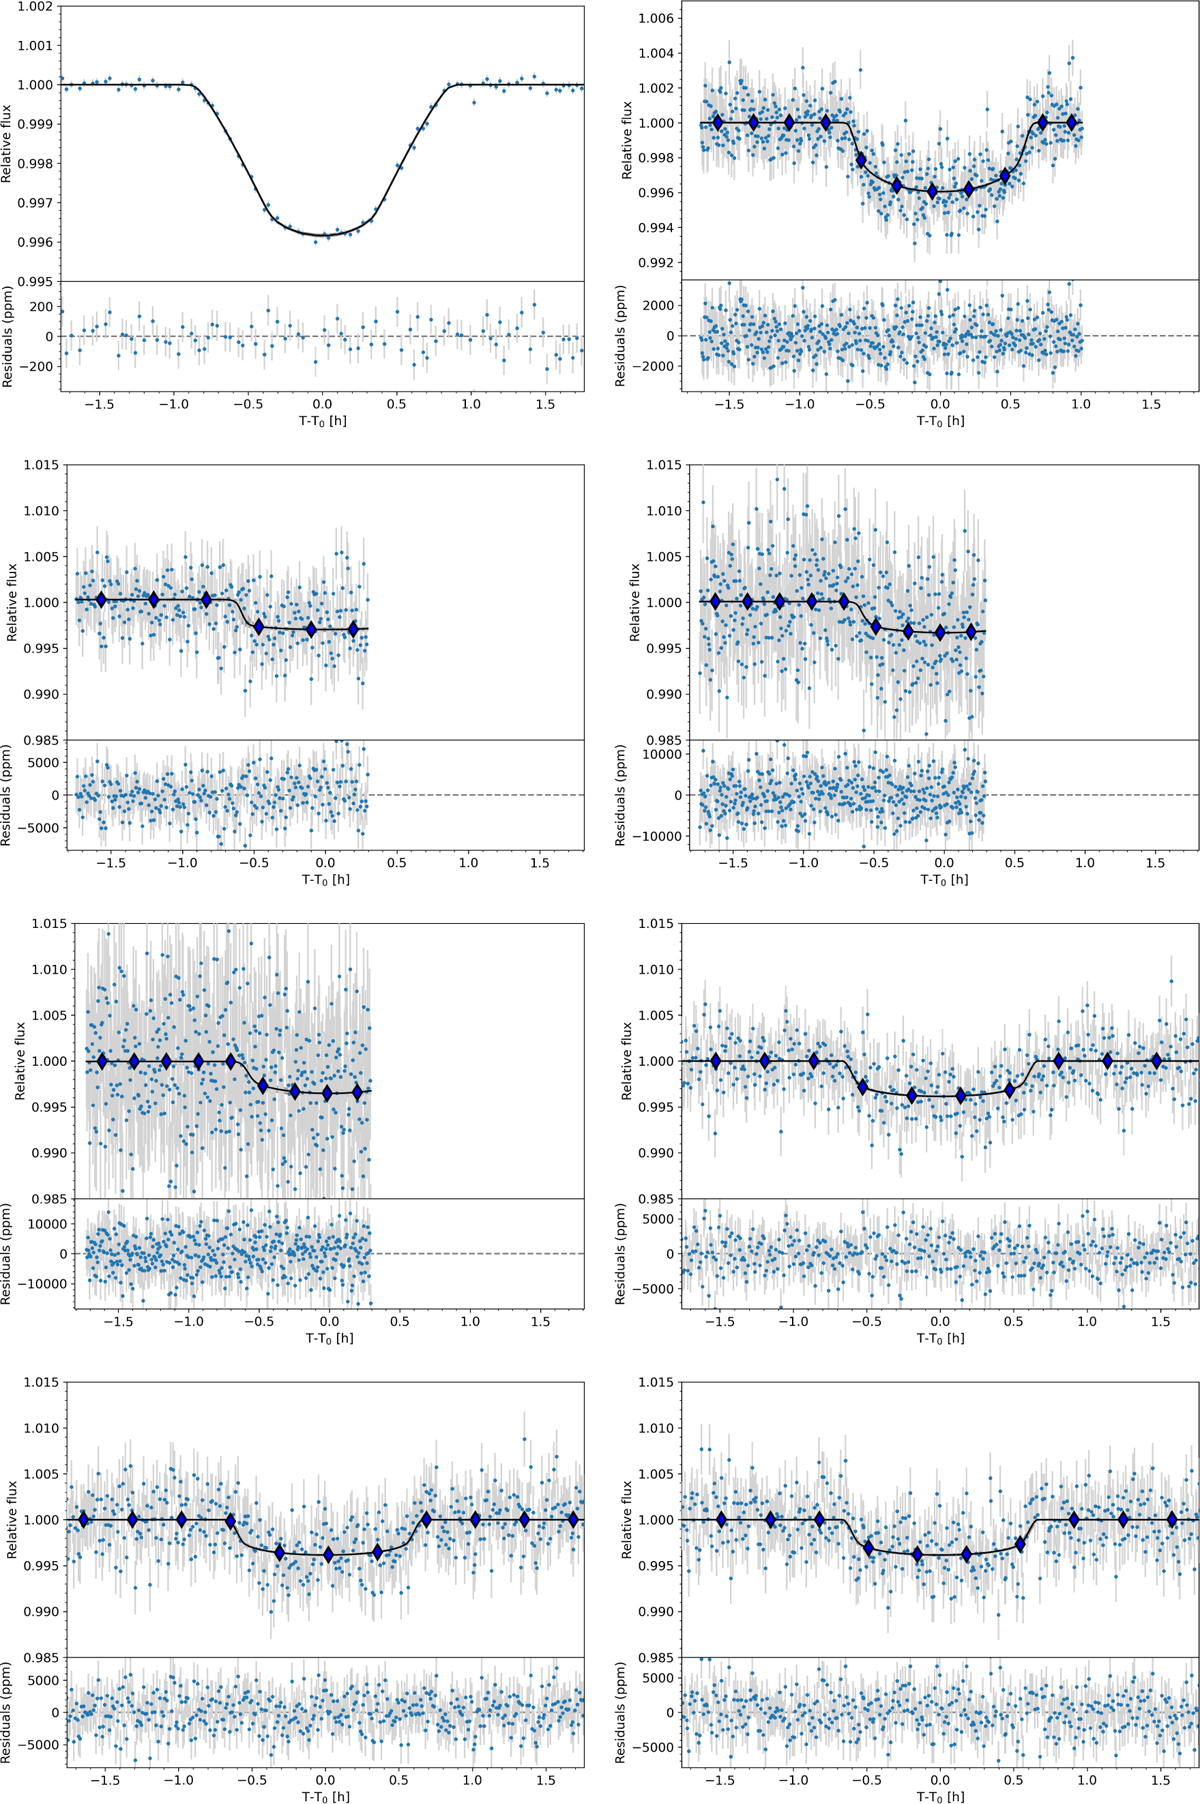
Fig. 4
Download original image
Phase-folded light curves of G 9–40 b. Top row: transits observed with K2 (left) and ARCTIC (right). Second row: transits observed with MuSCAT2 in r-band (left) and i-band (right). Third row: transits observed with MuSCAT2 in zs-band (left) and TESS Sector 44 (right). Bottom row: transits observed with TESS in Sectors 45 (left) and 46 (right). In all panels, the black lines and shaded areas indicate the detrended best fit model from Sect. 4.3 and its 1σ confidence interval, respectively. Below each panel, the residuals after the subtraction of the median best fit model are shown. Blue diamonds show binned points to improve visualization.
Current usage metrics show cumulative count of Article Views (full-text article views including HTML views, PDF and ePub downloads, according to the available data) and Abstracts Views on Vision4Press platform.
Data correspond to usage on the plateform after 2015. The current usage metrics is available 48-96 hours after online publication and is updated daily on week days.
Initial download of the metrics may take a while.