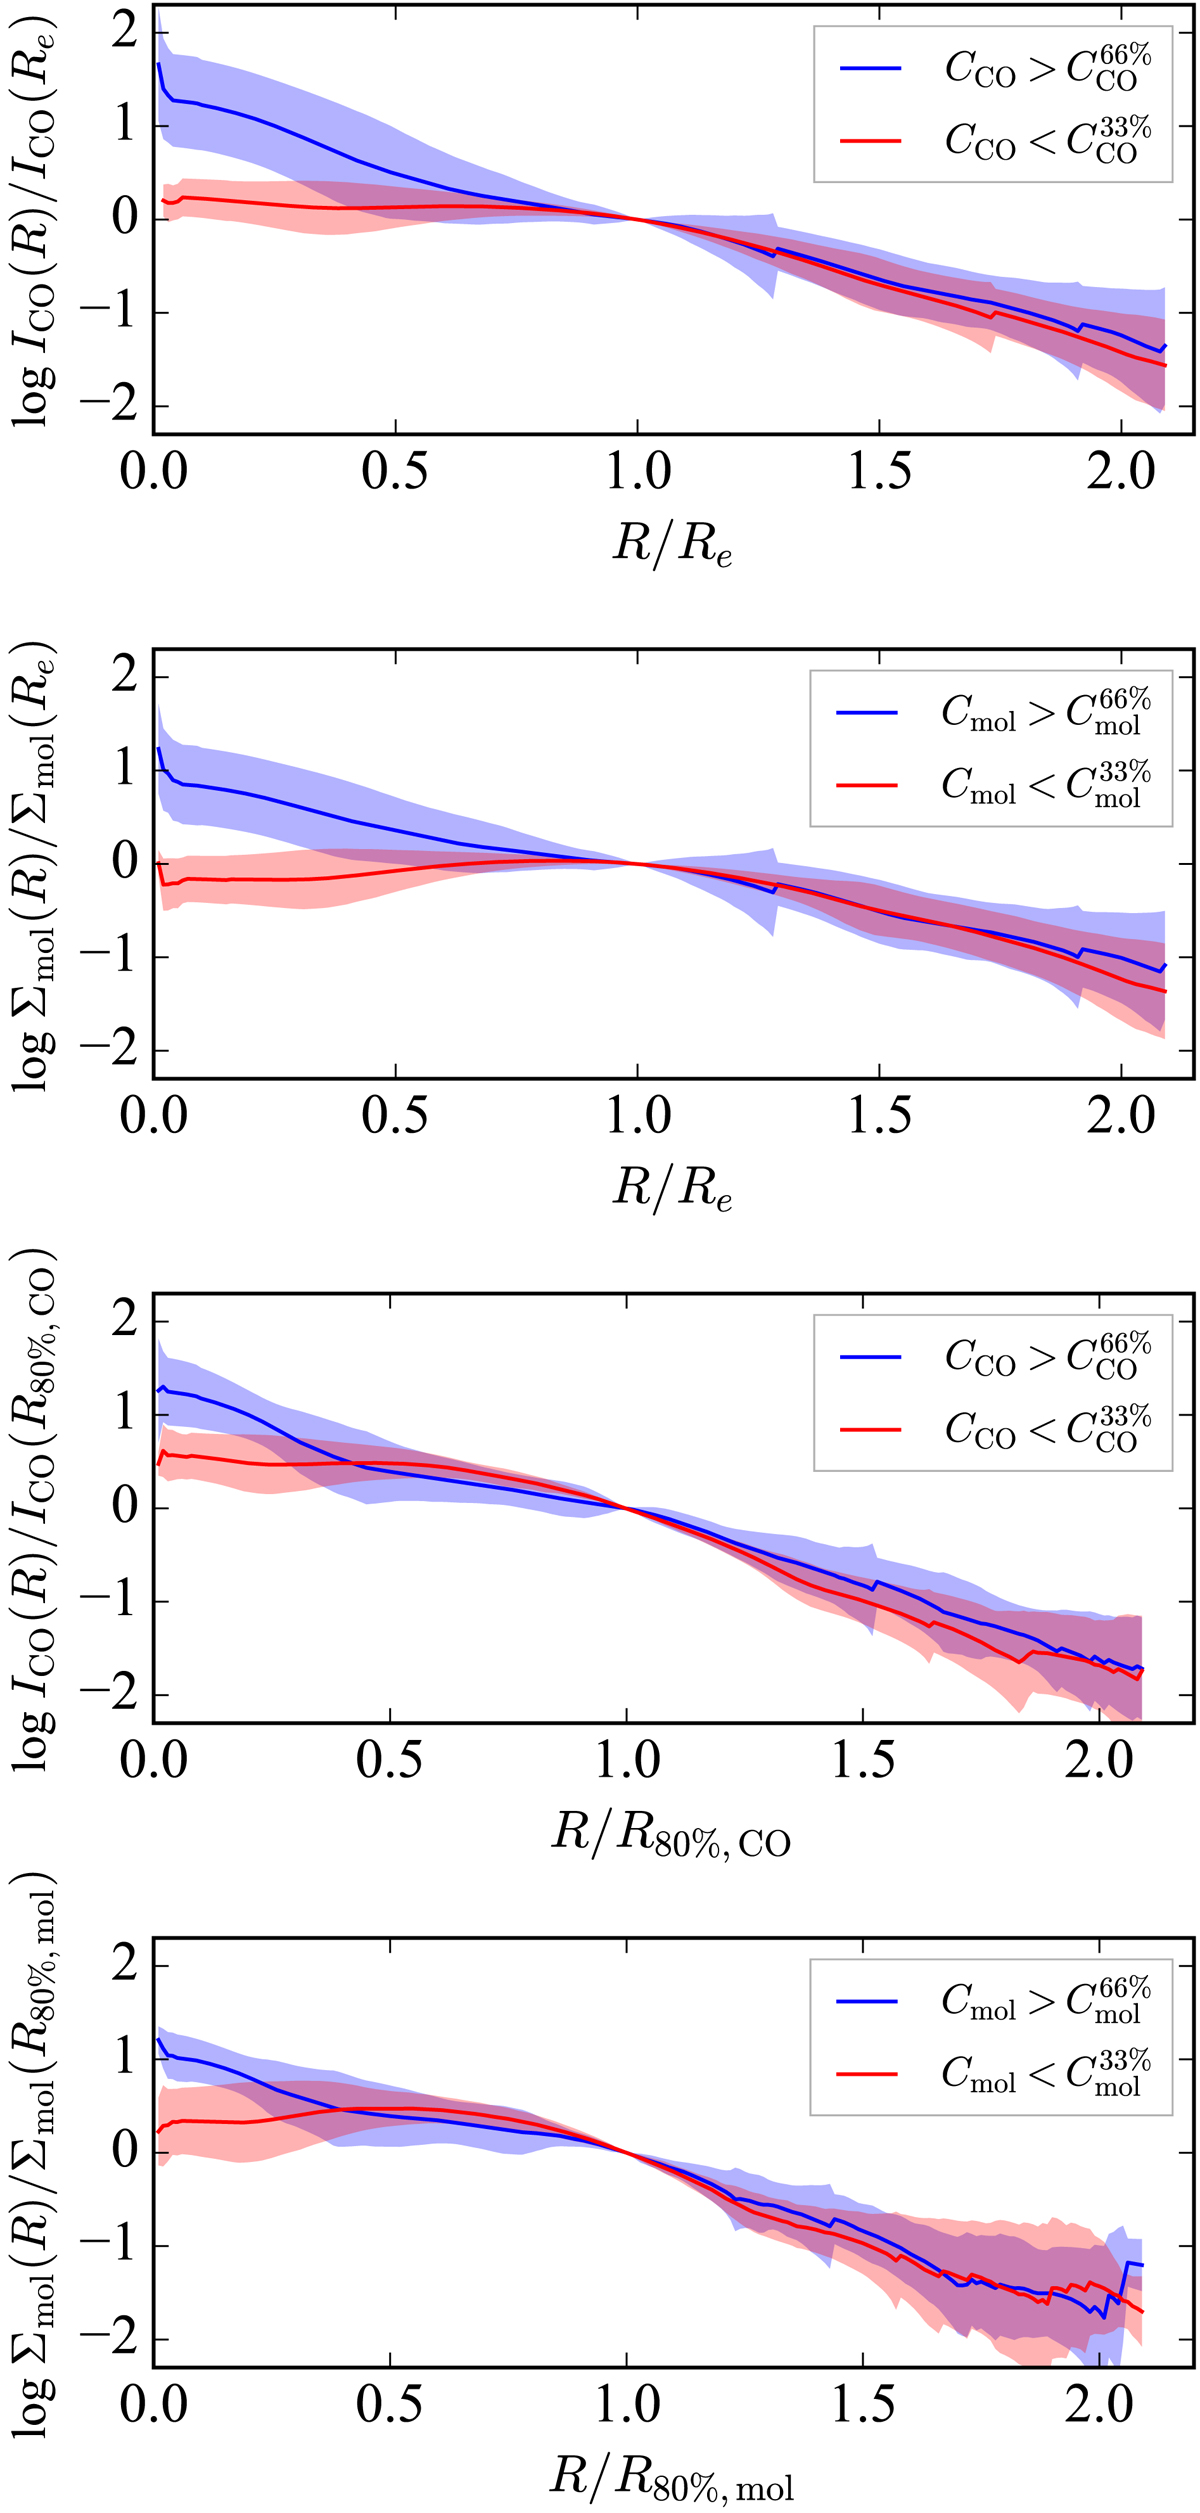
Fig. 5.
Download original image
Average normalized profiles of CO integrated intensity (ICO(R)/ICO(Re) and ICO(R)/ICO(R80%,CO)) and molecular mass surface density (Σmol(R)/Σmol(Re) and Σmol(R)/Σmol(R80%,mol)). Blue profiles are for high-CCO or high-Cmol galaxies, while red profiles are for low-CCO or low-Cmol galaxies. The shaded regions mark the standard deviation in y-axis value for a given normalized radius.
Current usage metrics show cumulative count of Article Views (full-text article views including HTML views, PDF and ePub downloads, according to the available data) and Abstracts Views on Vision4Press platform.
Data correspond to usage on the plateform after 2015. The current usage metrics is available 48-96 hours after online publication and is updated daily on week days.
Initial download of the metrics may take a while.