Fig. 6.
Download original image
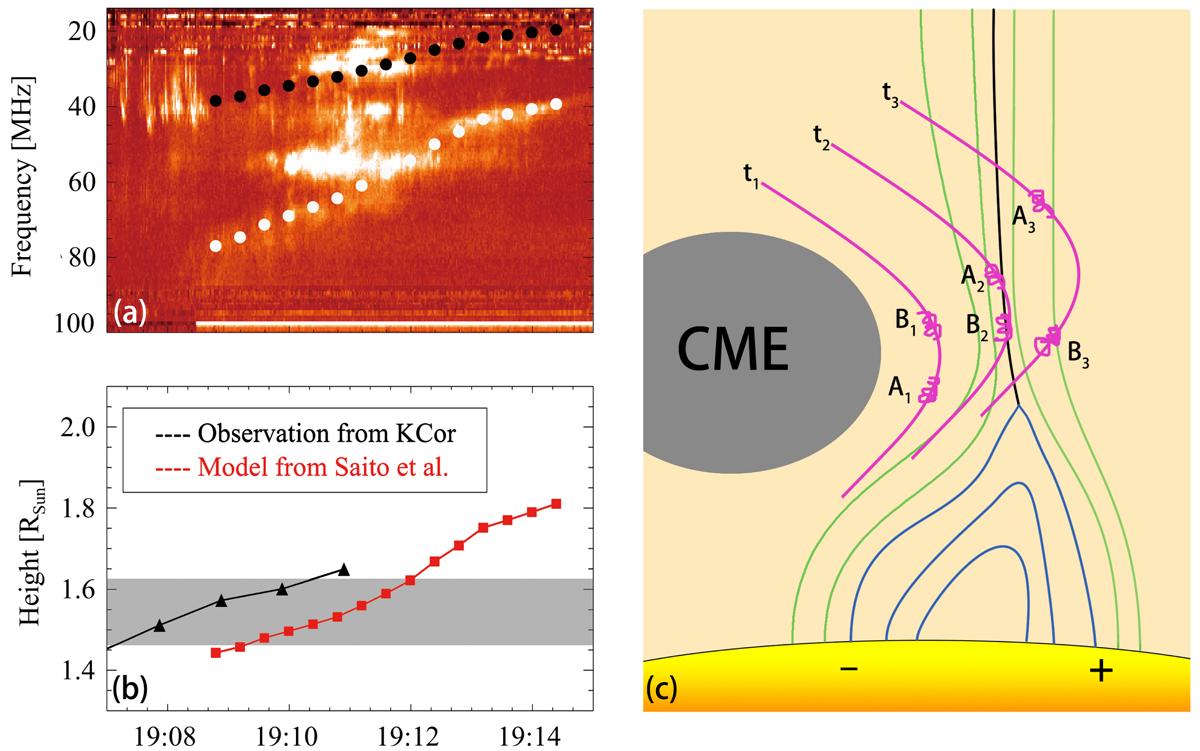
Properties and explanation of three types of radio bursts. (a) Radio dynamic spectrograph representing a drifting and stationary type II radio burst. The white (black) points mark the harmonic (fundamental) frequency of the drifting type II burst and are used to estimate the heights of the source region. (b) Height-time profiles of the drifting type II burst source region derived from the model of Saito et al. (1977, red) and of the interaction region between the CME and streamer estimated directly using the K-Cor data (black). The shaded region represents the possible initial height of the type III bursts. (c) Sketch interpreting the interaction between the CME shock and streamer. The green and blue curves are the opened and closed streamer magnetic field lines, the purple curves represent the CME-driven shock front, and the black curve is the streamer current sheet. The radio-emitting regions related to the type II bursts are marked Ai and Bi.
Current usage metrics show cumulative count of Article Views (full-text article views including HTML views, PDF and ePub downloads, according to the available data) and Abstracts Views on Vision4Press platform.
Data correspond to usage on the plateform after 2015. The current usage metrics is available 48-96 hours after online publication and is updated daily on week days.
Initial download of the metrics may take a while.